November 28, 2025 a 02:46 am


EQR: Dividend Analysis - Equity Residential
Equity Residential offers a robust dividend framework with a strong track record. Despite recent adjustments, its long history of consistent dividend distribution alongside strategic fiscal management positions them as a noteworthy choice for dividend-focused investors.
📊 Overview
The following table provides a brief overview of essential dividend metrics.
| Metric | Value |
|---|---|
| Sector | Real Estate |
| Dividend yield | 4.32% |
| Current dividend per share | 2.70 USD |
| Dividend history | 33 years |
| Last cut or suspension | 2024 |
📉 Dividend History
An evaluation of the dividend history illustrates the company's long-standing commitment to shareholder returns, reflective of its business stability and foresight in capital management.
| Year | Dividend Per Share (USD) |
|---|---|
| 2025 | 2.7525 |
| 2024 | 2.025 |
| 2023 | 2.65 |
| 2022 | 2.5 |
| 2021 | 2.41 |
📈 Dividend Growth
The dividend growth trend, while exhibiting some volatility, underscores a strategic adaptation in payout policies necessary for long-term sustainability.
| Time | Growth |
|---|---|
| 3 years | -5.64% |
| 5 years | -2.26% |
The average dividend growth is -2.26% over 5 years. This shows moderate but steady dividend growth.
🗣️ Payout Ratio
The payout ratios indicate the proportion of earnings and cash flow utilised for dividend payments, crucial for assessing dividend sustainability.
| Key figure | Ratio |
|---|---|
| EPS-based | 90.76% |
| Free cash flow-based | 82.02% |
The 90.76% (EPS) and 82.02% (FCF) payout ratios suggest high levels of distribution, indicating potential risk if earnings decline.
💸 Cashflow & Capital Efficiency
The cash flow and capital efficiency ratios provide insight into the company's ability to generate cash from its operations and the efficient use of its assets and equity.
| Year | 2024 | 2023 | 2022 |
|---|---|---|---|
| Free Cash Flow Yield | 5.34% | 5.18% | 5.51% |
| Earnings Yield | 4.82% | 3.61% | 3.50% |
| CAPEX to Operating Cash Flow | 20.77% | 21.76% | 15.96% |
| Stock-based Compensation to Revenue | 0.85% | 1.11% | 1.08% |
| Free Cash Flow / Operating Cash Flow Ratio | 79.75% | 78.24% | 84.04% |
The cash flow stability and capital efficiency indicate robust operations despite fluctuating economic conditions.
📊 Balance Sheet & Leverage Analysis
Equity Residential's balance sheet health and leverage ratios highlight its financial stability and risk exposure with respect to debt obligations.
| Year | 2024 | 2023 | 2022 |
|---|---|---|---|
| Debt-to-Equity | 0.763 | 0.695 | 0.692 |
| Debt-to-Assets | 0.404 | 0.384 | 0.383 |
| Debt-to-Capital | 0.433 | 0.410 | 0.409 |
| Net Debt to EBITDA | 4.144 | 4.300 | 4.502 |
The ratios reveal manageable leverage levels, supporting long-term growth plans while minimizing risk.
🧮 Fundamental Strength & Profitability
Analysis of profitability metrics affirms the company's ability to sustain operations and generate sufficient returns for reinvestment and distribution.
| Year | 2024 | 2023 | 2022 |
|---|---|---|---|
| Return on Equity (ROE) | 9.38% | 7.54% | 6.95% |
| Return on Assets (ROA) | 5.49% | 4.17% | 3.84% |
| Net Margin | 34.76% | 29.07% | 28.40% |
| EBIT Margin | 29.25% | 30.55% | 29.68% |
Equity Residential maintains solid profitability which enhances its ability to navigate financial challenges effectively.
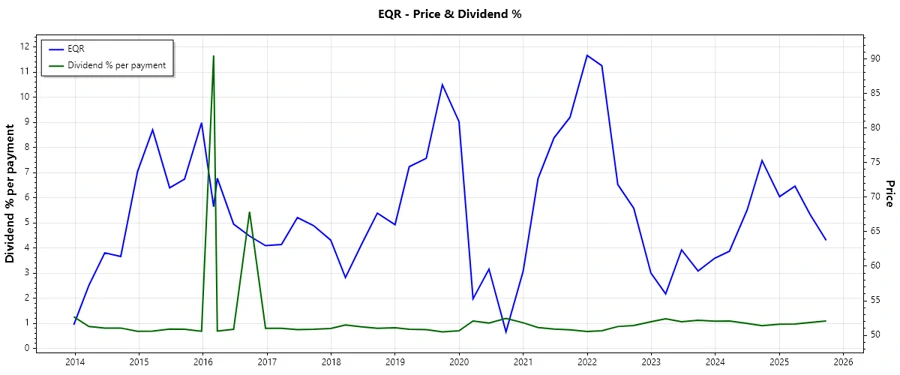
📈 Price Development
✅ Dividend Scoring System
| Criteria | Score | |
|---|---|---|
| Dividend yield | 4/5 | |
| Dividend Stability | 3/5 | |
| Dividend growth | 2/5 | |
| Payout ratio | 2/5 | |
| Financial stability | 3/5 | |
| Dividend continuity | 4/5 | |
| Cashflow Coverage | 3/5 | |
| Balance Sheet Quality | 4/5 |
Overall Score: 25/40
⚠️ Rating
Equity Residential exhibits a moderately attractive dividend profile with stable distribution policies and solid balance sheet management. Its ability to sustain dividends amidst economic challenges makes it suitable for income-focused investors who value long-term consistency over short-term yield spikes.