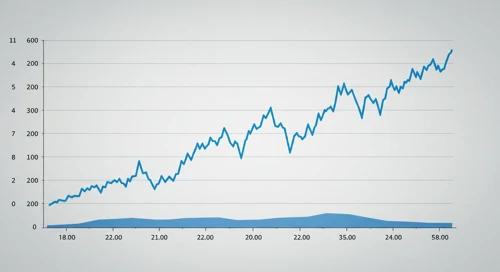
ADI: Trend with Support and Resistance Levels - Analog Devices Inc
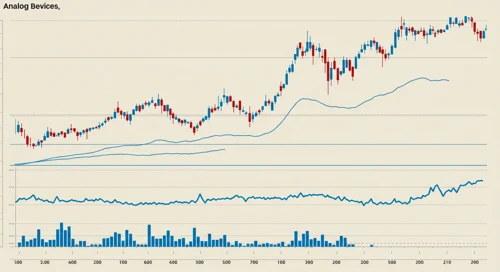
ADI: Current price trend is evaluated alongside key support and resistance level. View of potential turning points and price momentum.
July 19, 2026 a 04:03 am
FE: Dividend Analysis - FirstEnergy Corp
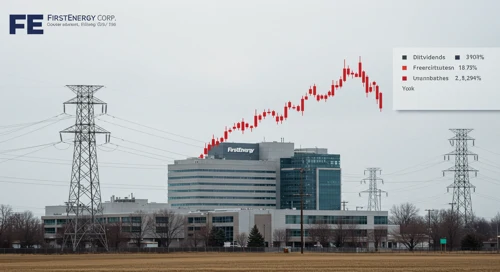
FE: In-depth analysis of a company's dividend stability and key fundamental ratios to assess its financial strength and long-term investment potential.
July 19, 2026 a 03:31 am
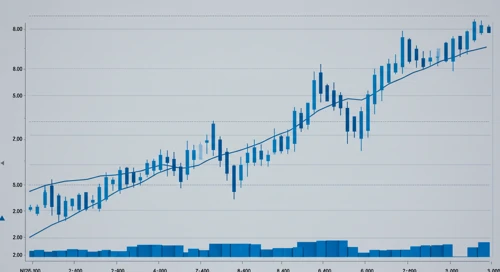
MTB: Trend with Support and Resistance Levels - MandT Bank Corporation
MTB: Current price trend is evaluated alongside key support and resistance level. View of potential turning points and price momentum.
July 19, 2026 a 03:15 am
TDG: Dividend Analysis - TransDigm Group Incorporated
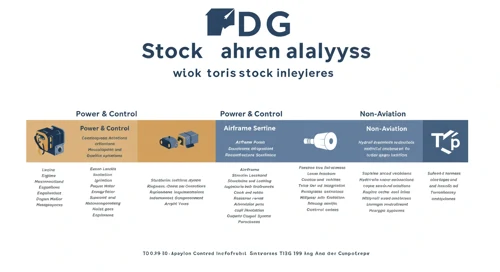
TDG: In-depth analysis of a company's dividend stability and key fundamental ratios to assess its financial strength and long-term investment potential.
July 19, 2026 a 02:46 am
NFLX: Analysts Ratings - Netflix Inc
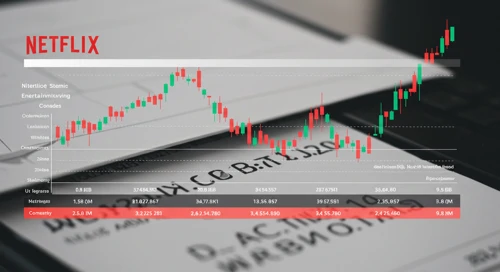
NFLX: Comprehensive breakdown of current and historical analyst ratings, offering insights into how expert sentiment has evolved over time.
July 18, 2026 a 09:00 pm
REGN: Analysts Ratings - Regeneron Pharmaceuticals Inc
REGN: Comprehensive breakdown of current and historical analyst ratings, offering insights into how expert sentiment has evolved over time.
July 18, 2026 a 08:38 pm
CASY: Fundamental Ratio Analysis - Caseys General Stores Inc

CASY: Evaluation of key financial ratios, analyst ratings, and price targets. A data-driven perspective on the valuation and market expectations.
July 18, 2026 a 07:43 pm
FOXA: Fibunacci Level Technical Analysis - Fox Corporation
July 19, 2026 a 06:44 am
BSX: Fibunacci Level Technical Analysis - Boston Scientific Corporation
July 19, 2026 a 05:15 am
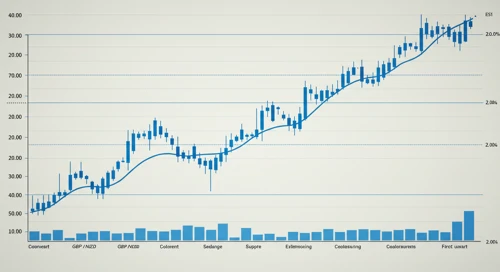
GBPAUD: Fibunacci Level Technical Analysis
July 19, 2026 a 05:08 am
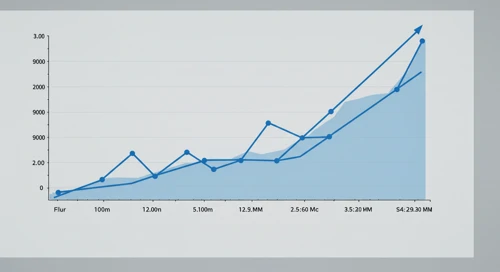
GBPNZD: Trend with Support and Resistance Levels
July 19, 2026 a 04:28 am
AVB: Fundamental Ratio Analysis - AvalonBay Communities Inc

AVB: Evaluation of key financial ratios, analyst ratings, and price targets. A data-driven perspective on the valuation and market expectations.
July 18, 2026 a 06:00 pm
WDAY: Analysts Ratings - Workday Inc

WDAY: Comprehensive breakdown of current and historical analyst ratings, offering insights into how expert sentiment has evolved over time.
July 18, 2026 a 05:00 pm
IRM: Fibunacci Level Technical Analysis - Iron Mountain Incorporated
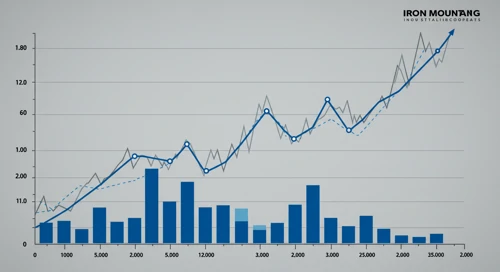
IRM: Fibonacci retracement levels to identify key potential support and resistance zones, based on recent price trends.
July 18, 2026 a 04:44 pm
IEX: Analysts Ratings - IDEX Corporation
IEX: Comprehensive breakdown of current and historical analyst ratings, offering insights into how expert sentiment has evolved over time.
July 18, 2026 a 04:38 pm
FIS: Fundamental Ratio Analysis - Fidelity National Information Services Inc

FIS: Evaluation of key financial ratios, analyst ratings, and price targets. A data-driven perspective on the valuation and market expectations.
July 18, 2026 a 03:43 pm
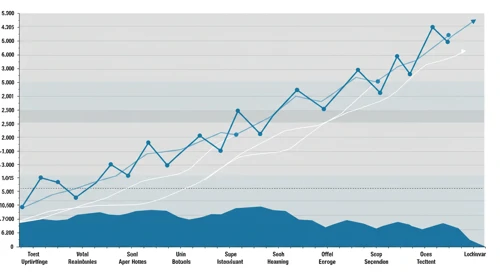
Consumer Staples Comparison. 18 Jul

Comparison of Consumer Staples. Where is strength and weakness? What has developed well and badly?
July 18, 2026 a 03:31 pm
WTW: Fibunacci Level Technical Analysis - Willis Towers Watson Public Limited Company
WTW: Fibonacci retracement levels to identify key potential support and resistance zones, based on recent price trends.
July 18, 2026 a 03:15 pm
Stock Market - Heatmap
Use mouse wheel to zoom in and out. Click a ticker to display detailed information in a new window. Hover mouse cursor over a ticker to see more data.
Stock's
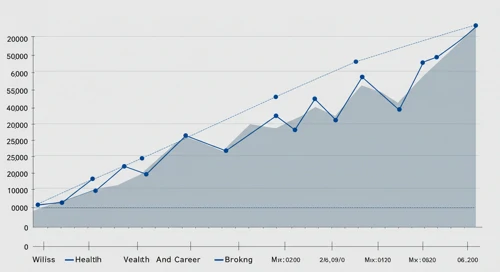
SYF: Analysts Ratings - Synchrony Financial
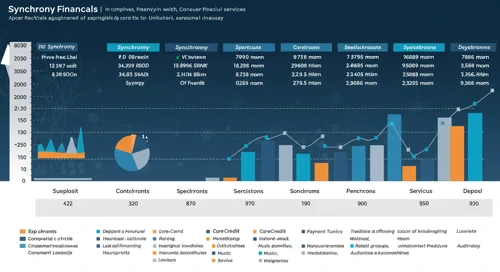
SYF: Comprehensive breakdown of current and historical analyst ratings, offering insights into how expert sentiment has evolved over time.
July 18, 2026 a 12:38 pm
KEY: Fibunacci Level Technical Analysis - KeyCorp
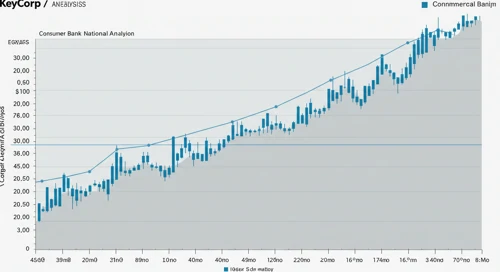
KEY: Fibonacci retracement levels to identify key potential support and resistance zones, based on recent price trends.
July 18, 2026 a 11:44 am
ROST: Fundamental Ratio Analysis - Ross Stores Inc
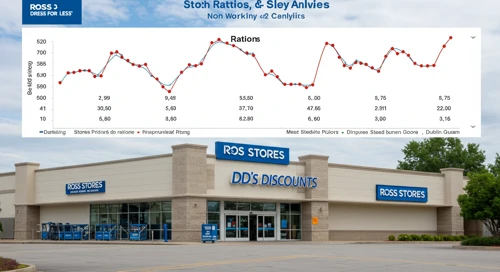
ROST: Evaluation of key financial ratios, analyst ratings, and price targets. A data-driven perspective on the valuation and market expectations.
July 18, 2026 a 11:43 am
GEN: Fibunacci Level Technical Analysis - Gen Digital Inc
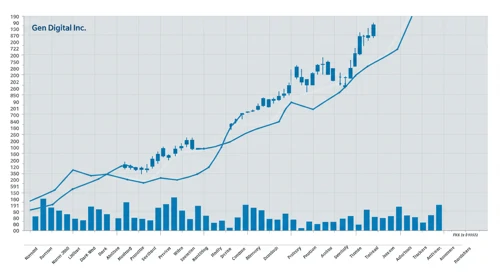
GEN: Fibonacci retracement levels to identify key potential support and resistance zones, based on recent price trends.
July 18, 2026 a 10:15 am
PAYX: Trend with Support and Resistance Levels - Paychex Inc

PAYX: Current price trend is evaluated alongside key support and resistance level. View of potential turning points and price momentum.
July 18, 2026 a 09:03 am
ZBH: Analysts Ratings - Zimmer Biomet Holdings Inc

ZBH: Comprehensive breakdown of current and historical analyst ratings, offering insights into how expert sentiment has evolved over time.
July 18, 2026 a 09:00 am
INTC: Analysts Ratings - Intel Corp
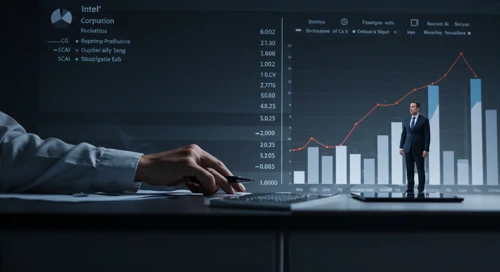
INTC: Comprehensive breakdown of current and historical analyst ratings, offering insights into how expert sentiment has evolved over time.
July 18, 2026 a 08:38 am
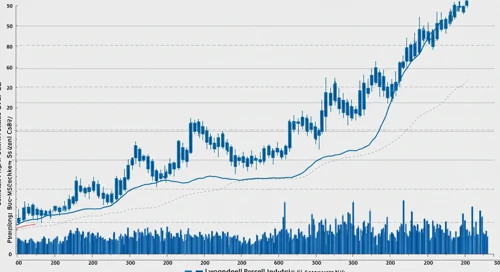
LYB: Trend with Support and Resistance Levels - LyondellBasell Industries NV
July 18, 2026 a 02:03 pm

SPG: Analysts Ratings - Simon Property Group Inc
July 18, 2026 a 01:00 pm
DDOG: Fundamental Ratio Analysis - Datadog Inc
July 18, 2026 a 01:00 pm
NVDA: Dividend Analysis - NVIDIA Corporation
July 18, 2026 a 12:46 pm
IFF: Trend with Support and Resistance Levels - International Flavors and Fragrances Inc
IFF: Current price trend is evaluated alongside key support and resistance level. View of potential turning points and price momentum.
July 18, 2026 a 08:15 am
AVGO: Fundamental Ratio Analysis - Broadcom Inc
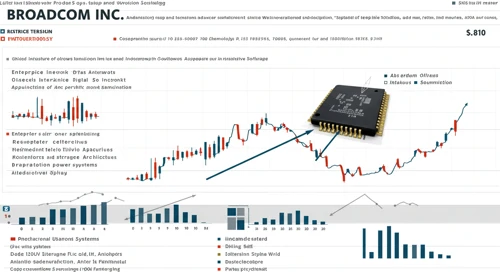
AVGO: Evaluation of key financial ratios, analyst ratings, and price targets. A data-driven perspective on the valuation and market expectations.
July 18, 2026 a 08:00 am
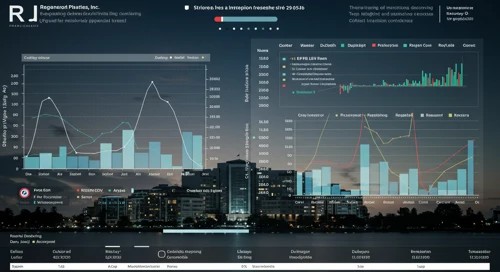
RJF: Dividend Analysis - Raymond James Financial Inc
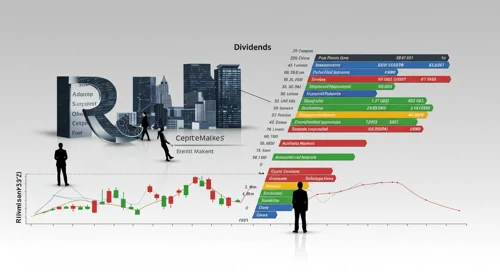
RJF: In-depth analysis of a company's dividend stability and key fundamental ratios to assess its financial strength and long-term investment potential.
July 18, 2026 a 07:46 am
TROW: Fundamental Ratio Analysis - T Rowe Price Group Inc

TROW: Evaluation of key financial ratios, analyst ratings, and price targets. A data-driven perspective on the valuation and market expectations.
July 18, 2026 a 07:43 am
SJM: Dividend Analysis - The J M Smucker Company
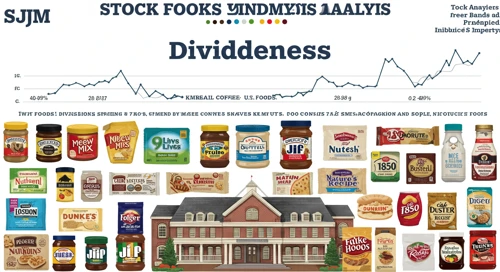
SJM: In-depth analysis of a company's dividend stability and key fundamental ratios to assess its financial strength and long-term investment potential.
July 18, 2026 a 07:31 am
AOS: Fibunacci Level Technical Analysis - A O Smith Corporation
AOS: Fibonacci retracement levels to identify key potential support and resistance zones, based on recent price trends.
July 18, 2026 a 06:44 am
JKHY: Fibunacci Level Technical Analysis - Jack Henry and Associates Inc
JKHY: Fibonacci retracement levels to identify key potential support and resistance zones, based on recent price trends.
July 18, 2026 a 05:15 am
Economic Calendar
Currencies
GBPUSD: Fibunacci Level Technical Analysis
GBPUSD: Fibonacci retracement levels to identify key potential support and resistance zones, based on recent price trends.
July 17, 2026 a 05:08 am
CHFJPY: Trend with Support and Resistance Levels
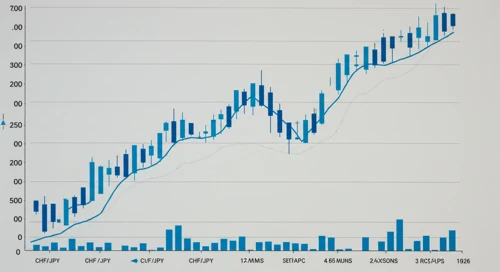
CHFJPY: Current price trend is evaluated alongside key support and resistance level. View of potential turning points and price momentum.
July 17, 2026 a 04:28 am
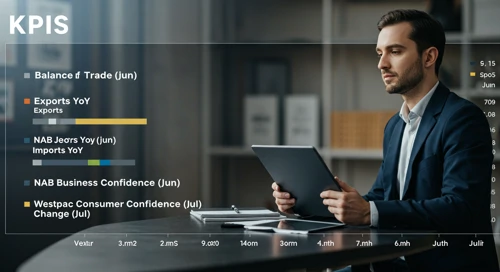
Todays Important Key Figures 16 Jul
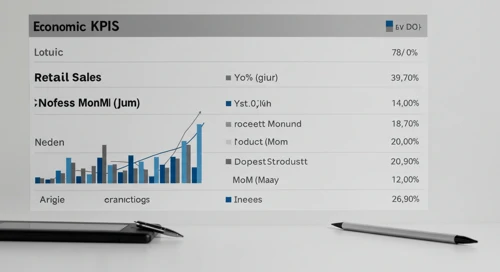
Today’s important economic data releases – a snapshot of key indicators influencing markets and shaping financial expectations.
July 16, 2026 a 07:00 pm
CADJPY: Fibunacci Level Technical Analysis
CADJPY: Fibonacci retracement levels to identify key potential support and resistance zones, based on recent price trends.
July 16, 2026 a 05:08 am
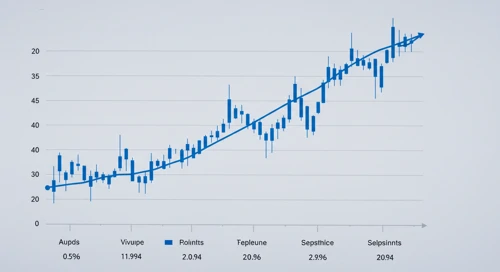
EURAUD: Trend with Support and Resistance Levels
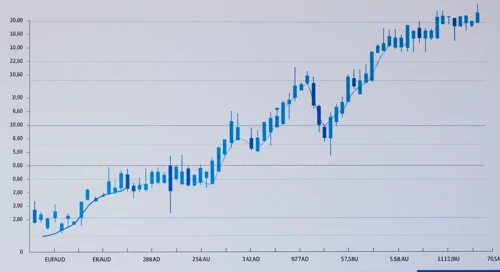
EURAUD: Current price trend is evaluated alongside key support and resistance level. View of potential turning points and price momentum.
July 16, 2026 a 04:28 am
Important Key Figures of the last Days

Overview of key economic indicators released over the past days, highlighting their potential impact on markets and investor sentiment.
July 16, 2026 a 02:31 am
Todays Important Key Figures 15 Jul

Today’s important economic data releases – a snapshot of key indicators influencing markets and shaping financial expectations.
July 15, 2026 a 07:00 pm
GBPCAD: Fibunacci Level Technical Analysis
July 18, 2026 a 05:08 am
NZDCAD: Trend with Support and Resistance Levels
July 18, 2026 a 04:28 am
Todays Important Key Figures 18 Jul
July 17, 2026 a 11:00 pm

Todays Important Key Figures 17 Jul
July 17, 2026 a 07:00 pm
CADCHF: Fibunacci Level Technical Analysis
CADCHF: Fibonacci retracement levels to identify key potential support and resistance zones, based on recent price trends.
July 15, 2026 a 05:08 am
GBPSEK: Trend with Support and Resistance Levels
GBPSEK: Current price trend is evaluated alongside key support and resistance level. View of potential turning points and price momentum.
July 15, 2026 a 04:28 am
Todays Important Key Figures 14 Jul

Today’s important economic data releases – a snapshot of key indicators influencing markets and shaping financial expectations.
July 14, 2026 a 07:00 pm
GBPCHF: Fibunacci Level Technical Analysis
GBPCHF: Fibonacci retracement levels to identify key potential support and resistance zones, based on recent price trends.
July 14, 2026 a 05:08 am
USDCHF: Trend with Support and Resistance Levels
USDCHF: Current price trend is evaluated alongside key support and resistance level. View of potential turning points and price momentum.
July 14, 2026 a 04:28 am
Important Key Figures of the last Days
Overview of key economic indicators released over the past days, highlighting their potential impact on markets and investor sentiment.
July 14, 2026 a 02:31 am
Todays Important Key Figures 13 Jul
Today’s important economic data releases – a snapshot of key indicators influencing markets and shaping financial expectations.
July 13, 2026 a 07:00 pm
Currencies