
July 22, 2026 a 03:15 am
EQIX: Trend and Support & Resistance Analysis - Equinix, Inc.
Equinix, Inc., a leader in digital infrastructure, offers significant opportunities to access a network of interconnected data centers globally. The company's strategic position supports digital acceleration for diverse businesses. Financial evaluation of its stock reveals important insights both for growth and risk management strategies. Understanding the recent trend is crucial for investors looking to harness potential gains or mitigate risks associated with market fluctuations.
Trend Analysis
| Date | Close Price | Trend |
|---|---|---|
| 2026-07-21 | 1027.88 | ⚖️ |
| 2026-07-20 | 1017.31 | ▼ |
| 2026-07-17 | 1020.00 | ▲ |
| 2026-07-16 | 1009.14 | ▼ |
| 2026-07-15 | 1022.60 | ▲ |
| 2026-07-14 | 1023.54 | ▲ |
| 2026-07-13 | 1039.53 | ▲ |
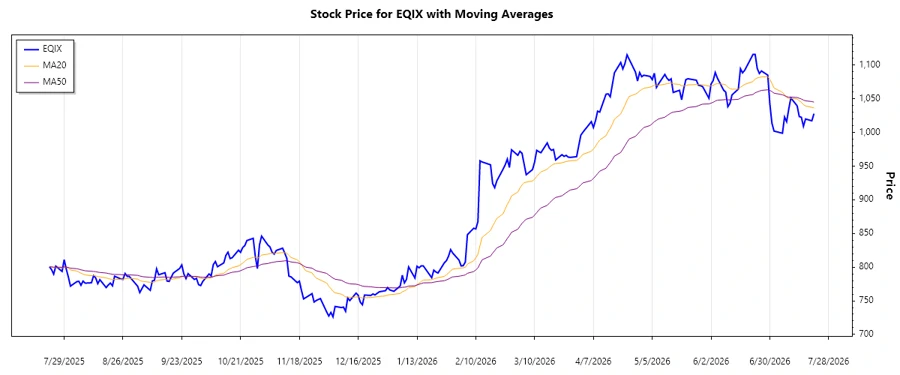
Based on the calculated EMAs, the trend over the period indicates a mostly sideways movement with alternating short-term ups and downs. This reflects market indecision.
Stock trend chart illustrating EQIX's recent price movement.
Support and Resistance
| Zone Type | Zone Range |
|---|---|
| Support Zone 1 | ▼ 1000 - 1020 ▼ |
| Support Zone 2 | ▼ 980 - 995 ▼ |
| Resistance Zone 1 | ▲ 1050 - 1070 ▲ |
| Resistance Zone 2 | ▲ 1085 - 1100 ▲ |
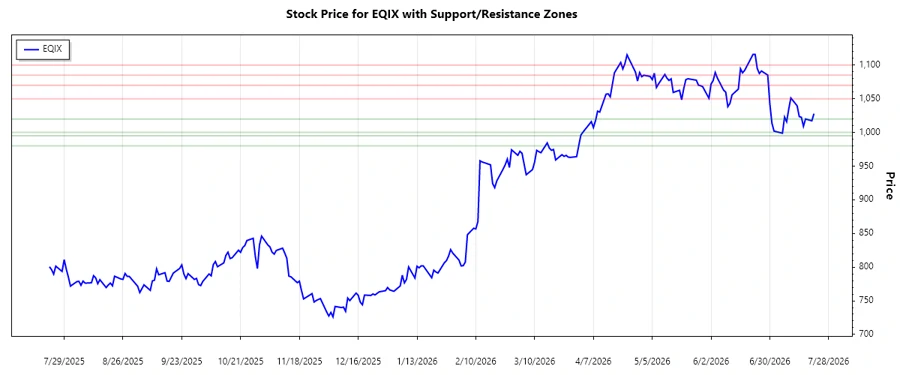
The current price is placed near the first support zone, indicating potential buying interest. If the price falls below this zone, it might test the lower support.
Chart showing critical support and resistance areas for EQIX.
Conclusion
The current market analysis of Equinix, Inc. shows a balanced situation with a possible soft trend that may pivot in either direction. Support and resistance zones offer guidance for trading decisions. For investors, Equinix represents potential growth opportunities backed by its robust data infrastructure ecosystem. However, they must remain cautious about market volatility. Analysts should focus on these technical indicators to assess entry and exit points accurately. Risk management practices must be applied in this volatile segment.
Smart Data Insight
Master the Perfect Entry & Exit for this Stock
Don't leave your profits to chance. Historically, this stock follows specific seasonal patterns that institutional traders use to maximize returns.
- ✅ Identify the "Golden Buying Window"
- ✅ Avoid high-risk correction cycles
- ✅ Backtested data from the last 20+ years