May 12, 2026 a 05:15 am
EQIX: Fibonacci Analysis - Equinix, Inc.
Equinix, Inc. (NASDAQ: EQIX) has shown remarkable resilience in digital infrastructure, catering to expanding digital transformation needs. Recent analysis indicates a strong upward trend, attributed to its strategic investments and partnerships, facilitating seamless digital services globally. This analysis uses Fibonacci retracement levels to evaluate potential price movements and support or resistance levels.
Fibonacci Analysis
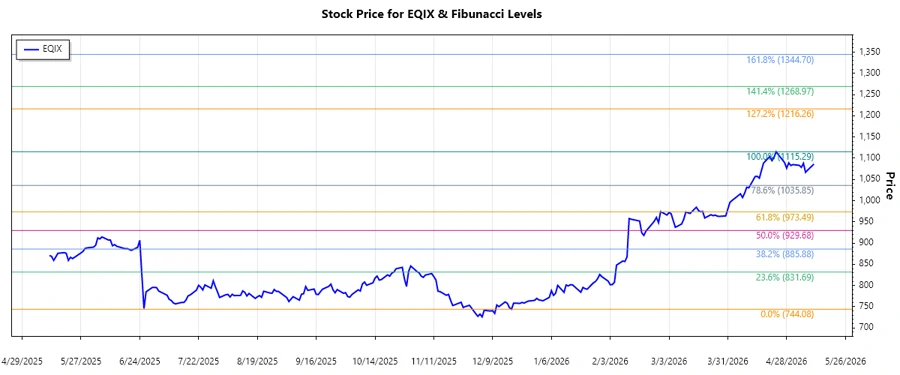
This analysis explores the recent upward trend in the Equinix, Inc. stock, which peaked at $1115.29 on 2026-04-23 from a low of $744.08 on 2025-12-18. By calculating the Fibonacci retracement levels, we assess potential zones for price correction.
| Analysis Detail | Value |
|---|---|
| Start Date | 2025-12-18 |
| End Date | 2026-04-23 |
| High Point (Price/Date) | $1115.29 / 2026-04-23 |
| Low Point (Price/Date) | $744.08 / 2025-12-18 |
| 0.236 Level | $1039.69 |
| 0.382 Level | $970.62 |
| 0.5 Level | $929.69 |
| 0.618 Level | $888.76 |
| 0.786 Level | $826.04 |
As of the last data point, the current price stands at $1086.22, placing it above the 0.236 retracement level, indicating potential continued bullish momentum unless the price retraces significantly.
The technical interpretation suggests this price level currently acts as a support, with further upside potential if momentum continues.
Conclusion
In summary, Equinix, Inc. stock is experiencing an upward trend, demonstrating its pivotal role in the digital infrastructure sector. This momentum reflects strong investor confidence, yet vigilance is necessary given potential market corrections. Fibonacci levels provide investors critical insight into potential support and resistance zones, guiding informed decision-making.
Smart Data Insight
Master the Perfect Entry & Exit for this Stock
Don't leave your profits to chance. Historically, this stock follows specific seasonal patterns that institutional traders use to maximize returns.
- ✅ Identify the "Golden Buying Window"
- ✅ Avoid high-risk correction cycles
- ✅ Backtested data from the last 20+ years