November 13, 2025 a 10:15 am
EQIX: Fibonacci Analysis - Equinix, Inc.
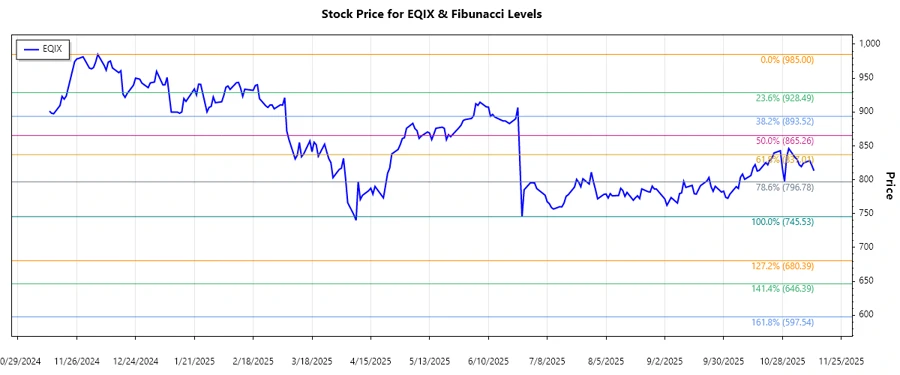
Equinix, Inc. has shown a fluctuating performance in recent months. The company, known for its robust digital infrastructure, faced an overall decline in stock prices, indicating an ongoing downtrend. This analysis takes into account the historical price movements to present a Fibonacci Retracement view of EQIX's potential support and resistance levels.
Fibonacci Analysis
| Start Date | End Date | High (Date) | Low (Date) | Fibonacci Levels | Current Price | Retracement Zone | Technical Interpretation |
|---|---|---|---|---|---|---|---|
| 2025-01-02 | 2025-11-12 | $985 (2024-12-06) | $745.53 (2025-06-26) |
0.236: $820.94 0.382: $860.69 0.5: $865.57 0.618: $905.32 0.786: $945.07 |
$813.24 | 0.236 | The current price is slightly below the 0.236 retracement level, indicating a weak support zone. Further decline may test lower support levels. |
Conclusion
The current analysis identifies a persistent downtrend for Equinix, Inc. stock, with critical support not observed until the 0.5 Fibonacci level. There is risk involved if the price continues to slip below the 0.236 level, as it suggests limited immediate support. Despite the digital infrastructure company's robust business model, stock performance has been bearish. Traders should monitor further developments and be cautious about potential downswings. The technical picture signals possible resistance at the 0.382 and 0.5 levels, serving as critical junctures for evaluating positions. Maintaining caution is advisable until a definitive reversal pattern emerges.
Smart Data Insight
Master the Perfect Entry & Exit for this Stock
Don't leave your profits to chance. Historically, this stock follows specific seasonal patterns that institutional traders use to maximize returns.
- ✅ Identify the "Golden Buying Window"
- ✅ Avoid high-risk correction cycles
- ✅ Backtested data from the last 20+ years