September 22, 2025 a 03:15 pm
EQIX: Fibonacci Analysis - Equinix, Inc.
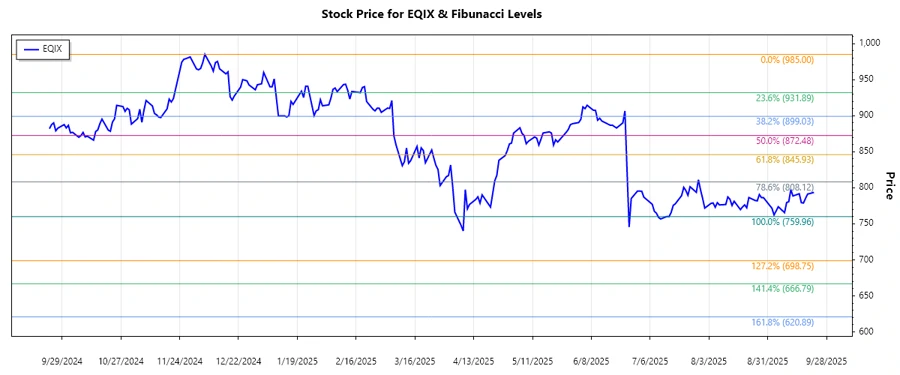
Equinix, Inc. (NASDAQ: EQIX) has demonstrated robust digital infrastructure capabilities, providing crucial interconnectivity for businesses worldwide. The recent trend observed in the stock data is a downtrend, indicating a period of bearish sentiment. This presents a pivotal moment for investors to assess potential retracement levels and strategize accordingly.
Fibonacci Analysis
The analysis of Equinix's recent stock performance highlights a downward trend. Applying the Fibonacci retracement tool, we have identified key levels that could serve as potential areas of support or resistance.
| Description | Value |
|---|---|
| Trend Start Date | 2024-12-06 |
| Trend End Date | 2025-09-22 |
| High Price (2024-12-06) | $985.00 |
| Low Price (2025-09-22) | $759.96 |
Fibonacci Retracement Levels:
| Level | Price |
|---|---|
| 0.236 | $833.73 |
| 0.382 | $870.94 |
| 0.500 | $872.50 |
| 0.618 | $911.06 |
| 0.786 | $955.47 |
Current Price is in the 0.382 retracement zone, suggesting minor support.
This level could suggest a temporary support; if the price stabilizes, there might be a potential for a reversal.
Conclusion
The recent downtrend in EQIX shares indicates caution for short-term investors, with current prices hovering around critical Fibonacci support levels. While a reversal is possible, the underlying bearish momentum could persist. Equinix's technological prowess in digital infrastructure remains a long-term strength, potentially providing resilience against broader market fluctuations. Nevertheless, investors should remain vigilant, considering both macroeconomic factors and market sentiment, while monitoring potential buy signals around the identified retracement zones.
Smart Data Insight
Master the Perfect Entry & Exit for this Stock
Don't leave your profits to chance. Historically, this stock follows specific seasonal patterns that institutional traders use to maximize returns.
- ✅ Identify the "Golden Buying Window"
- ✅ Avoid high-risk correction cycles
- ✅ Backtested data from the last 20+ years