January 28, 2026 a 11:31 am


EQIX: Dividend Analysis - Equinix, Inc.
Equinix, Inc. has showcased a commendable commitment to its shareholders by consistently delivering dividends over the years. With a steady 12-year dividend history, coupled with an impressive annual distribution per share, EQIX is an attractive proposition for dividend-focused investors. The company's approach towards ensuring a promising dividend yield, currently at 2.45%, establishes it as a cornerstone for diversified portfolios.
📊 Overview
| Metric | Value |
|---|---|
| Sector | Technology |
| Dividend yield | 2.45 % |
| Current dividend per share | 17.21 USD |
| Dividend history | 12 years |
| Last cut or suspension | 2016 |
📈 Dividend History
The dividend history highlights the company’s unwavering commitment to rewarding shareholders. A robust history signifies reliability and trust in Equinix, providing a reassuring gauge of the company’s financial health and its strategic foresight in maintaining shareholder value.
| Year | Dividend per Share (USD) |
|---|---|
| 2025 | 18.76 |
| 2024 | 17.04 |
| 2023 | 14.49 |
| 2022 | 12.40 |
| 2021 | 11.48 |
📈 Dividend Growth
Dividend growth is paramount in assessing future payout potential. Equinix has demonstrated a consistent upward trend, reflecting confidence in its stable cash flow generation and strategic emphasis on returning value to shareholders.
| Time | Growth |
|---|---|
| 3 years | 14.80 % |
| 5 years | 12.01 % |
The average dividend growth is 12.01 % over 5 years. This shows moderate but steady dividend growth.
📊 Payout Ratio
The payout ratio is a critical measure of dividend sustainability. High ratios can indicate potential financial stress with the risk of future dividend cuts if earnings fluctuate. Equinix’s EPS-based payout ratio is 157.47%, and FCF-based is 95.37%, indicating an aggressive dividend policy that might not be sustainable in the long run.
| Key figure | Ratio (%) |
|---|---|
| EPS-based | 157.47 % |
| Free cash flow-based | 95.37 % |
These figures suggest that while dividends are well-funded by cash flow, the reliance on earnings indicates potential risk if profitability declines.
📊 Cashflow & Capital Efficiency
Analyzing cash flow metrics offers insights into operational liquidity, efficiency, and company strength driven by cash generation rather than accounting profits. Equinix's metrics highlight effective cash use strategies, though attention should be paid to stock-based compensation metrics relative to revenue as a dilution flag.
| Metric | 2024 | 2023 | 2022 |
|---|---|---|---|
| Free Cash Flow Yield | 0.20 % | 0.58 % | 1.14 % |
| Earnings Yield | 0.91 % | 1.28 % | 1.17 % |
| CAPEX to Operating Cash Flow | 94.37 % | 86.46 % | 76.88 % |
| Stock-based Comp. to Revenue | 5.28 % | 4.98 % | 5.56 % |
| Free Cash Flow / Operating Cash Flow Ratio | 5.63 % | 13.54 % | 23.12 % |
The company's ability to manage cash efficiently indicates strong operational health, though increased stock-based compensation represents potential dilution risk.
📊 Balance Sheet & Leverage Analysis
Understanding leverage and liquidity positions within the balance sheet context is vital for assessing long-term viability. Equinix shows high debt levels, aligning with sector norms, but could pose future risk if covenants tighten amidst changing economic conditions.
| Metric | 2024 | 2023 | 2022 |
|---|---|---|---|
| Debt-to-Equity | 1.40 | 1.40 | 1.43 |
| Debt-to-Assets | 0.54 | 0.53 | 0.54 |
| Debt-to-Capital | 0.58 | 0.58 | 0.59 |
| Net Debt to EBITDA | 4.61 | 4.56 | 4.98 |
| Current Ratio | 1.63 | 1.13 | 1.80 |
| Quick Ratio | 1.63 | 1.13 | 1.80 |
| Financial Leverage | 2.59 | 2.61 | 2.63 |
The firm's leverage position supports infrastructure and operational expansion, yet observed levels require ongoing scrutiny to avoid over-leveraging in volatile conditions.
📊 Fundamental Strength & Profitability
Profitability measures define company strength, with ROE and ROA being strong indicators of management effectiveness and operational efficiency. Equinix's margins provide a snapshot of its ability to manage cost structures while ensuring healthy returns amidst competition.
| Metric | 2024 | 2023 | 2022 |
|---|---|---|---|
| Return on Equity | 6.02 % | 7.76 % | 6.12 % |
| Return on Assets | 2.32 % | 2.97 % | 2.32 % |
| Net Margin | 9.32 % | 11.84 % | 9.70 % |
| EBIT Margin | 16.37 % | 18.64 % | 16.32 % |
| EBITDA Margin | 39.33 % | 41.17 % | 40.23 % |
| Gross Margin | 48.94 % | 48.36 % | 48.35 % |
| Research & Development / Revenue | 0 % | 0 % | 0 % |
Equinix shows robust profitability metrics, leveraging operational efficiencies and strategic market positioning to drive competitive advantage in its sector.
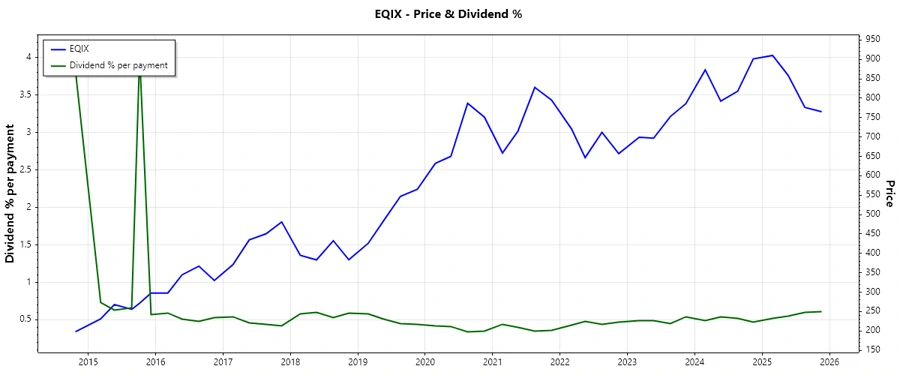
📈 Price Development
🗳️ Dividend Scoring System
| Category | Score | Score Bar |
|---|---|---|
| Dividend yield | 4 | |
| Dividend Stability | 5 | |
| Dividend Growth | 3 | |
| Payout Ratio | 2 | |
| Financial Stability | 3 | |
| Dividend Continuity | 5 | |
| Cashflow Coverage | 3 | |
| Balance Sheet Quality | 2 |
Total Score: 27/40
🏆 Rating
Equinix, Inc. presents a firm dividend proposition, enhanced by consistent growth and reinvestment strategies. However, high payout ratios prompt caution, making it suitable for investors who prioritize yield with a tolerance for calculated risk.