January 26, 2026 a 12:47 pm


EQIX: Dividend Analysis - Equinix, Inc.
Equinix has established a robust dividend profile with a notable track record of 12 years without a cut or suspension since 2016. Its dividend yield of 2.45% offers an attractive income stream for investors. However, the company's high EPS payout ratio suggests potential constraints in dividend coverage, warranting cautious optimism.
📊 Overview
Equinix operates within the real estate sector, offering a dividend yield of 2.45% on a current dividend per share of approximately $17.21. The company boasts a steady dividend history of 12 years, with the last cut or suspension dating back to 2016.
| Metric | Value |
|---|---|
| Sector | Real Estate |
| Dividend Yield | 2.45% |
| Current Dividend Per Share | $17.21 |
| Dividend History | 12 years |
| Last Cut or Suspension | 2016 |
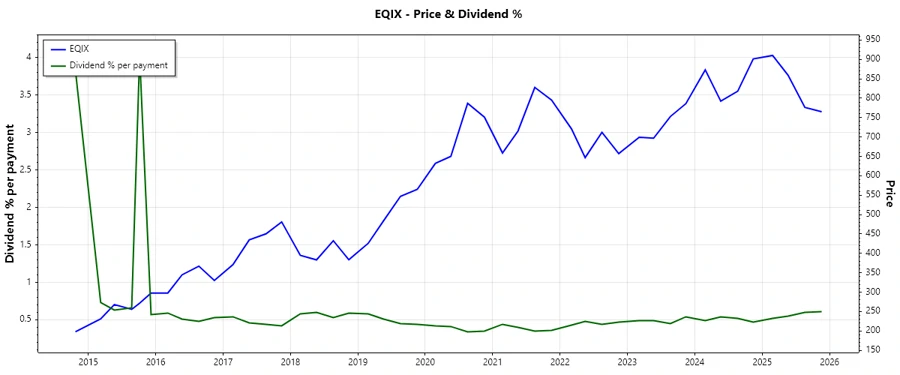
📈 Dividend History
The dividend history of Equinix is a testament to its commitment to returning value to shareholders. Consistent dividend payments over the last decade highlight its reliability as a stable income-generating investment.
| Year | Dividend Per Share (USD) |
|---|---|
| 2025 | $18.76 |
| 2024 | $17.04 |
| 2023 | $14.49 |
| 2022 | $12.40 |
| 2021 | $11.48 |
🔍 Dividend Growth
Analyzing dividend growth is crucial in evaluating long-term returns. Equinix shows a modest growth of 14.8% over the past three years and 12.0% over five years, reflecting a gradual increase in dividend yields which denotes a balanced approach to rewarding shareholders.
| Time | Growth |
|---|---|
| 3 years | 14.80% |
| 5 years | 12.00% |
The average dividend growth is 12.0% over 5 years. This shows moderate but steady dividend growth.
💡 Payout Ratio
The payout ratio is a key determinant of dividend sustainability. Equinix's EPS-based payout ratio stands at 157.47%, indicating payouts beyond its earnings. However, the FCF-based ratio is at 95.37%, suggesting dividends are still covered by cash flows, albeit tightly.
| Key Figure | Ratio |
|---|---|
| EPS-based | 157.47% |
| Free Cash Flow-based | 95.37% |
While the EPS payout ratio is exceptionally high, relying on free cash flow provides a safer margin for the company's dividend strategy.
💳 Cashflow & Capital Efficiency
Cash flow metrics provide insights into the company's financial health and operational efficiency. The key ratios show varying figures, with CAPEX to Operating Cash Flow indicating significant reinvestment into business operations.
| Year | Free Cash Flow Yield | Earnings Yield | CAPEX to Operating Cash Flow | Stock-based Compensation to Revenue | Free Cash Flow / Operating Cash Flow Ratio |
|---|---|---|---|---|---|
| 2024 | 0.20% | 0.91% | 0.94% | 5.28% | 5.63% |
| 2023 | 0.58% | 1.29% | 0.86% | 4.98% | 13.54% |
| 2022 | 1.14% | 1.17% | 0.77% | 5.56% | 23.12% |
These metrics underscore the company’s managed but stretched cash flow availability, with room for optimizing CAPEX utilization.
🔗 Balance Sheet & Leverage Analysis
An analysis of Equinix's balance sheet indicates a leveraged stance with debt playing a significant role. The debt-to-equity ratio at 1.40 and net debt to EBITDA ratio over 5 highlight these concerns.
| Year | Debt-to-Equity | Debt-to-Assets | Debt-to-Capital | Net Debt to EBITDA | Current Ratio | Quick Ratio | Financial Leverage |
|---|---|---|---|---|---|---|---|
| 2024 | 1.40 | 0.54 | 0.58 | 4.61 | 1.62 | 1.62 | 2.59 |
| 2023 | 1.40 | 0.53 | 0.58 | 4.56 | 1.13 | 1.13 | 2.61 |
| 2022 | 1.43 | 0.54 | 0.59 | 4.98 | 1.80 | 1.80 | 2.63 |
The leverage analysis shows a strong dependency on debt; however, key liquidity ratios provide a buffer against short-term obligations.
🏦 Fundamental Strength & Profitability
Profitability metrics such as Return on Equity and margins provide a lens into operational effectiveness. The company's ROE and net margin reflect modest profitability amidst a capital-intensive business model.
| Year | Return on Equity | Return on Assets | Net Margin | EBIT Margin | EBITDA Margin | Gross Margin | R&D to Revenue |
|---|---|---|---|---|---|---|---|
| 2024 | 6.02% | 2.32% | 9.31% | 16.37% | 39.33% | 48.94% | 0.00% |
| 2023 | 7.76% | 2.97% | 11.84% | 18.64% | 41.17% | 48.36% | 0.00% |
| 2022 | 6.12% | 2.32% | 9.70% | 16.32% | 40.23% | 48.35% | 0.00% |
These values suggest a consistent yet modest level of profitability, characteristic of a company balancing growth investments with operational returns.
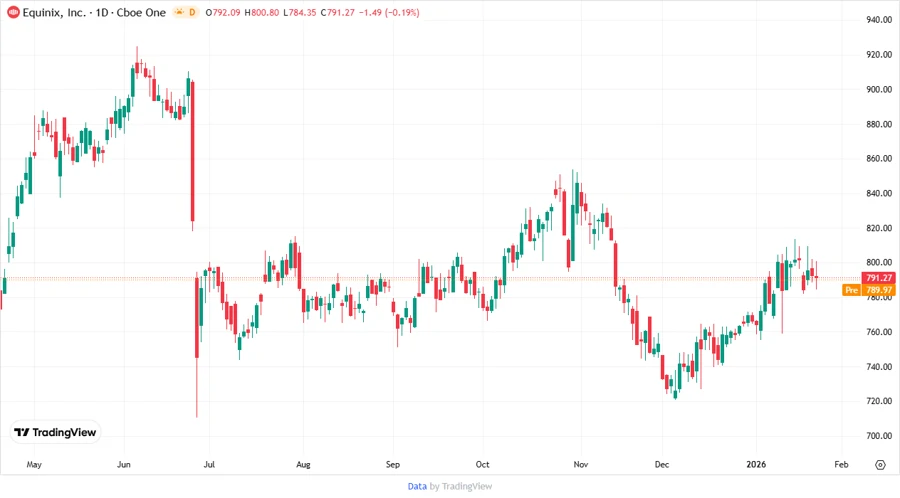
📉 Price Development
🗣️ Dividend Scoring System
| Category | Score (Out of 5) | Score Bar |
|---|---|---|
| Dividend Yield | 3 | |
| Dividend Stability | 4 | |
| Dividend Growth | 3 | |
| Payout Ratio | 2 | |
| Financial Stability | 3 | |
| Dividend Continuity | 4 | |
| Cashflow Coverage | 2 | |
| Balance Sheet Quality | 3 |
Total Score: 24/40
✅ Rating
Equinix, Inc. presents a compelling investment case with a stable dividend history and moderate growth profile. Despite the challenges posed by high payout ratios and leverage, its strategic positioning in the real estate sector and commitment to dividends make it a viable option for income-focused investors looking for resilience with room for improvement.