January 01, 2026 a 11:30 am
EQIX: Dividend Analysis - Equinix, Inc.
Equinix, Inc., renowned in the market for its robust data center services, has exhibited consistent dividend performance over the years. With a market capitalization exceeding $74 billion, the company's financial stewardship reflects its solid position in delivering proactive growth and value to shareholders through dividend distributions. Despite facing challenges in the form of a high payout ratio, Equinix demonstrates resilience in sustaining its dividend integrity.
📊 Overview
Analyzing the operational scale and dividend context of Equinix, the company operates prominently within the technology sector, exhibiting a dividend yield of 2.45%. The current dividend per share stands at $17.21, with a commendable history of dividend distribution over the past 12 years without recent cuts.
| Metric | Value |
|---|---|
| Sector | Technology |
| Dividend yield | 2.45% |
| Current dividend per share | 17.21 USD |
| Dividend history | 12 years |
| Last cut or suspension | 2016 |
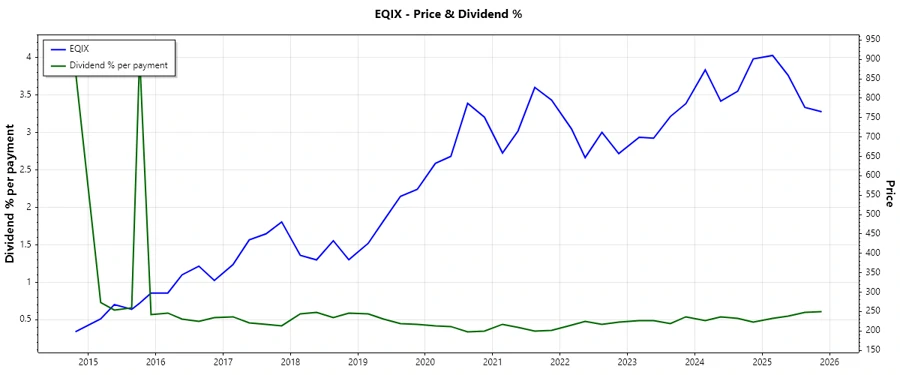
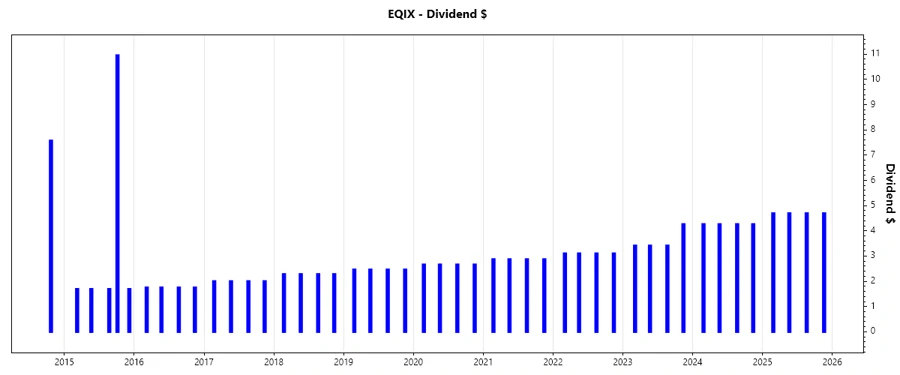
🗣️ Dividend History
Equinix's dividend history reflects a reliable increase in payouts, indicative of financial health and commitment to shareholder returns. Retaining consistency in dividend payments is pivotal for investor confidence and long-term planning.
| Year | Dividend per Share (USD) |
|---|---|
| 2025 | 18.76 |
| 2024 | 17.04 |
| 2023 | 14.49 |
| 2022 | 12.40 |
| 2021 | 11.48 |
📈 Dividend Growth
Understanding the potential for dividend increases, Equinix showcases a three-year growth rate of 14.80% and five-year growth of 12.01%. This growth underscores a progressive trajectory in shareholder returns.
| Time | Growth |
|---|---|
| 3 years | 14.80% |
| 5 years | 12.01% |
The average dividend growth is 12.01% over 5 years. This shows moderate but steady dividend growth.
📉 Payout Ratio
The payout ratio is a crucial indicator of dividend sustainability. Equinix's EPS-based payout ratio of 157.47% indicates a stretch beyond its earnings capabilities, whereas the free cash flow-based payout metric stands at 94.75%, showing significant reliance on its cash generation ability.
| Key figure | Ratio |
|---|---|
| EPS-based | 157.47% |
| Free cash flow-based | 94.75% |
The high EPS-based payout ratio raises concerns regarding earnings coverage, contrasting with the somewhat safer, yet substantial, FCF ratio.
💵 Cashflow & Capital Efficiency
An illustration of Equinix’s cash flow nuances and capital management suggests a tactical balance between operational cash generation and its capital expenditure habits. Analyzing such cash flow metrics is pivotal for apprising liquidity and investment return.
| Metric | 2024 | 2023 | 2022 |
|---|---|---|---|
| Free Cash Flow Yield | 0.20% | 0.58% | 1.14% |
| Earnings Yield | 0.91% | 1.29% | 1.17% |
| CAPEX to Operating Cash Flow | 94.36% | 86.46% | 76.88% |
| Stock-based Compensation to Revenue | 5.28% | 4.98% | 5.56% |
| Free Cash Flow / Operating Cash Flow Ratio | 5.63% | 13.54% | 23.12% |
The stringent capital efficiency and cash flow measures delineate Equinix's adeptness at resource allocation, yet the minimalistic free cash flow yield signals cautious optimism.
🏦 Balance Sheet & Leverage Analysis
a more robust exploration of debt metrics is vital since Equinix bears a substantial debt profile; it is essential to measure its solvency and liquidity through these crucial balance sheet insights.
| Metric | 2024 | 2023 | 2022 |
|---|---|---|---|
| Debt-to-Equity | 1.40 | 1.40 | 1.43 |
| Debt-to-Assets | 0.54 | 0.53 | 0.54 |
| Debt-to-Capital | 0.58 | 0.58 | 0.59 |
| Net Debt to EBITDA | 5.08 | 4.56 | 4.98 |
| Current Ratio | 1.62 | 1.13 | 1.80 |
| Quick Ratio | 1.62 | 1.13 | 1.80 |
| Financial Leverage | 2.59 | 2.61 | 2.63 |
The elevated debt metrics reflect a strategic borrowing initiative, yet it is accompanied by prudent liquidity ratios, mitigating risk exposure to an extent.
✅ Fundamental Strength & Profitability
Delving into profitability indicators reflects Equinix's ability to utilize equity and assets effectively while maintaining sound profit margins. Such metrics are instrumental for assessing operational efficiency.
| Metric | 2024 | 2023 | 2022 |
|---|---|---|---|
| Return on Equity (ROE) | 6.02% | 7.76% | 6.12% |
| Return on Assets (ROA) | 2.32% | 2.97% | 2.32% |
| Net Margin | 9.32% | 11.84% | 9.70% |
| EBIT Margin | 16.37% | 18.64% | 16.32% |
| EBITDA Margin | 39.33% | 41.17% | 40.23% |
| Gross Margin | 48.94% | 48.36% | 48.35% |
| Research & Development to Revenue | 0% | 0% | 0% |
The consistent return metrics highlight sustainability in core operations, while profit margins bolster Equinix's competitive edge through cost management.
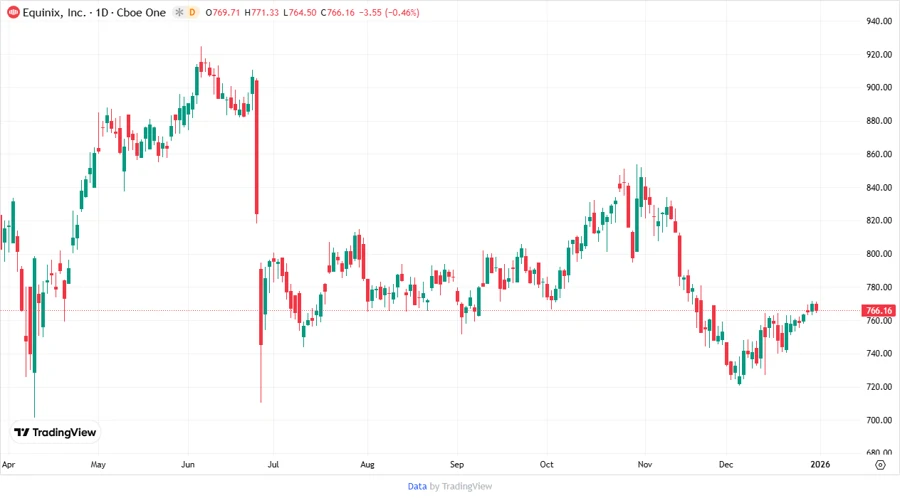
📈 Price Development
🏅 Dividend Scoring System
| Criteria | Score | Score Bar |
|---|---|---|
| Dividend Yield | 3 | |
| Dividend Stability | 4 | |
| Dividend Growth | 3 | |
| Payout Ratio | 2 | |
| Financial Stability | 3 | |
| Dividend Continuity | 4 | |
| Cashflow Coverage | 2 | |
| Balance Sheet Quality | 3 |
Total Score: 24/40
📊 Rating
Equinix, Inc. is positioned as a steady dividend provider with its commendable dividend history and moderate growth potential. However, the high payout ratios highlight potential risks, underlining a cautious stance. Investors might find value in its earnings trajectory but should account for the substantial debt levels. Overall, Equinix presents a balanced investment avenue with mindful considerations of its fiscal strategies and market-standing.