April 19, 2025 a 04:00 am

EPAM: Trend and Support & Resistance Analysis - EPAM Systems, Inc.
EPAM Systems, Inc., specializing in digital platform engineering and software development services, faces dynamic market challenges and opportunities. The technical analysis of recent stock data suggests a consistent trend, driven by broader industry shifts and the company's strategic initiatives. Investors in EPAM should keep a close eye on key support and resistance levels to navigate potential market fluctuations effectively.
Trend Analysis
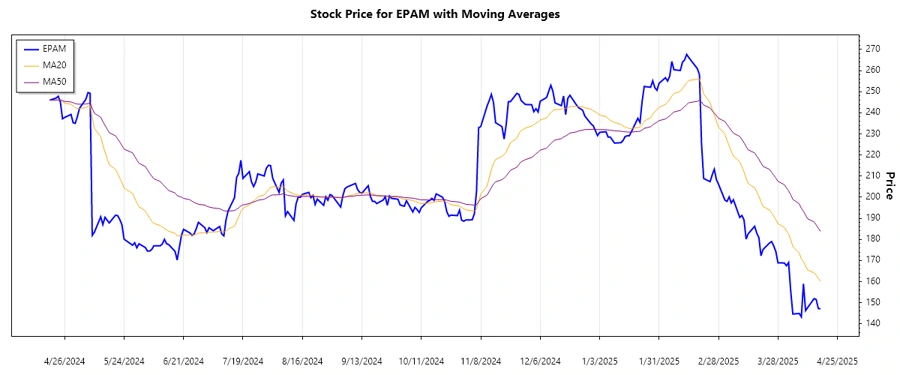
Analyzing the recent price data for EPAM Systems, Inc., the stock has exhibited some volatility. By calculating and examining the EMA20 and EMA50, certain trends become apparent. When interpreting these EMAs, a consistent downward trend has been identified in the most recent dates.
| Date | Close Price | Trend |
|---|---|---|
| 2025-04-17 | 147.16 | ▼ Down |
| 2025-04-16 | 147.28 | ▼ Down |
| 2025-04-15 | 151.55 | ▼ Down |
| 2025-04-14 | 151.97 | ▼ Down |
| 2025-04-11 | 147.76 | ▼ Down |
| 2025-04-10 | 146.29 | ▼ Down |
| 2025-04-09 | 159.00 | ▲ Up |
Technically, the prevailing EMA analyses indicate a downward momentum, suggesting cautious trading behavior may be warranted.
Support- and Resistance
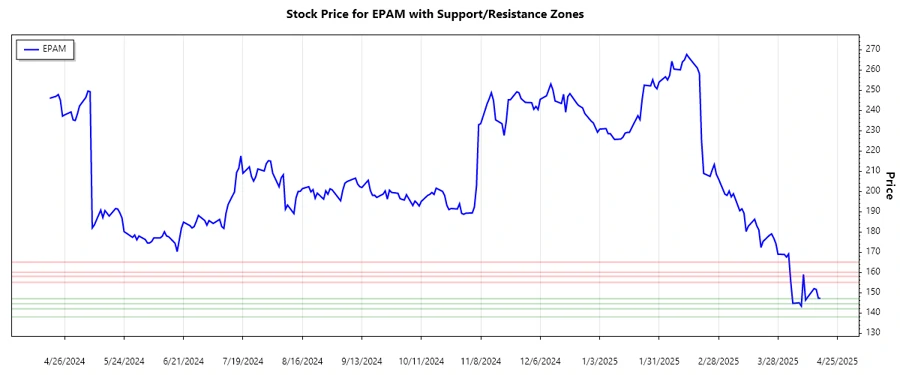
Based on the recent price data analysis, pivotal support and resistance zones have been identified that might influence future price movements.
| Zone | From | To |
|---|---|---|
| Support Zone 1 | 144.50 | 147.00 |
| Support Zone 2 | 138.00 | 142.00 |
| Resistance Zone 1 | 155.00 | 158.00 |
| Resistance Zone 2 | 160.00 | 165.00 |
Currently, the stock price is testing the lower support zone. Continuous monitoring of these levels is crucial for potential reversal signals.
Conclusion
The EPAM stock exhibits a recent downward trend with critical support levels being tested. Investors should evaluate the resilience of the support zones to identify potential buying opportunities. Conversely, the breaking of resistance levels can indicate a shift in momentum, offering selling opportunities. The company's foundational strengths in technology services provide a solid base yet require careful navigation through market volatilities.
Smart Data Insight
Master the Perfect Entry & Exit for this Stock
Don't leave your profits to chance. Historically, this stock follows specific seasonal patterns that institutional traders use to maximize returns.
- ✅ Identify the "Golden Buying Window"
- ✅ Avoid high-risk correction cycles
- ✅ Backtested data from the last 20+ years