
July 17, 2026 a 03:15 am

EOG: Trend and Support & Resistance Analysis - EOG Resources, Inc.
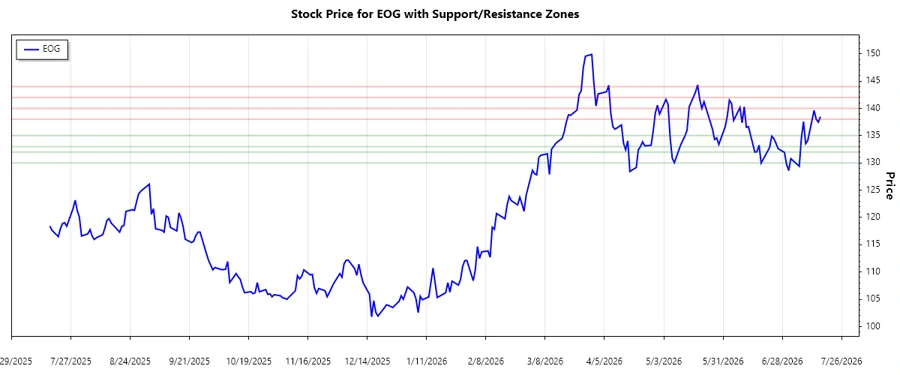
EOG Resources, Inc., a company engaged in the exploration and marketing of crude oil and natural gas, shows complex trading trends over the observed period. Technical analysis of recent price movements indicates a slight upward trajectory. Investors will want to pay close attention to both support and resistance levels, which demonstrate the stock's volatility and potential opportunities for strategic entry and exit.
Trend Analysis
The analysis based on the last few months of price data for EOG Resources, Inc. shows significant fluctuations. The current EMA20 trend is slightly above the EMA50, indicative of a ▲ bullish movement. However, periods of volatility can cause short-term disruptions that require careful monitoring.
| Date | Closing Price ($) | Trend |
|---|---|---|
| 2026-07-16 | 138.46 | ▲ Bullish |
| 2026-07-15 | 137.47 | ▲ Bullish |
| 2026-07-14 | 138.01 | ▲ Bullish |
| 2026-07-13 | 139.61 | ▲ Bullish |
| 2026-07-10 | 134.10 | ▲ Bullish |
| 2026-07-09 | 133.54 | ▲ Bullish |
| 2026-07-08 | 137.59 | ▲ Bullish |
Conclusions from this analysis suggest that while the stock is trending upwards, vigilantly observing these trends and adjusting strategies can maximize return potential.
Support and Resistance
Based on the technical analysis, key support and resistance levels have been identified. The data shows the potential for short-term holds within these zones, suggesting points for potential trade decisions.
| Support Zone (From - To) | Resistance Zone (From - To) |
|---|---|
| 130.00 - 132.00 | 138.00 - 140.00 |
| 133.00 - 135.00 | 142.00 - 144.00 |
The current stock price is positioned in the lower support zone, providing potential opportunities for accumulation. Investors should watch for price action near resistance to signal a potential change in trend.
Conclusion
The technical analysis of EOG Resources, Inc. hints at a gradually strengthening price trend with sensitive support and resistance levels. A bullish outlook is backed by the current EMA settings. Potential risks include short-term downturns, but if resistance levels are broken, there could be significant upward momentum. This data-driven evaluation can help investors make informed decisions when considering trade opportunities, directing strategic buying or selling actions around existing zones.
Smart Data Insight
Master the Perfect Entry & Exit for this Stock
Don't leave your profits to chance. Historically, this stock follows specific seasonal patterns that institutional traders use to maximize returns.
- ✅ Identify the "Golden Buying Window"
- ✅ Avoid high-risk correction cycles
- ✅ Backtested data from the last 20+ years