
July 12, 2026 a 09:03 am

EOG: Trend and Support & Resistance Analysis - EOG Resources, Inc.
EOG Resources has shown resilience in navigating market dynamics within the energy sector. It remains a strong player with its focus on crude oil and natural gas production. This technical analysis will provide an insight into recent trends observed in its stock prices alongside important support and resistance zones, helping analysts make informed projections.
Trend Analysis
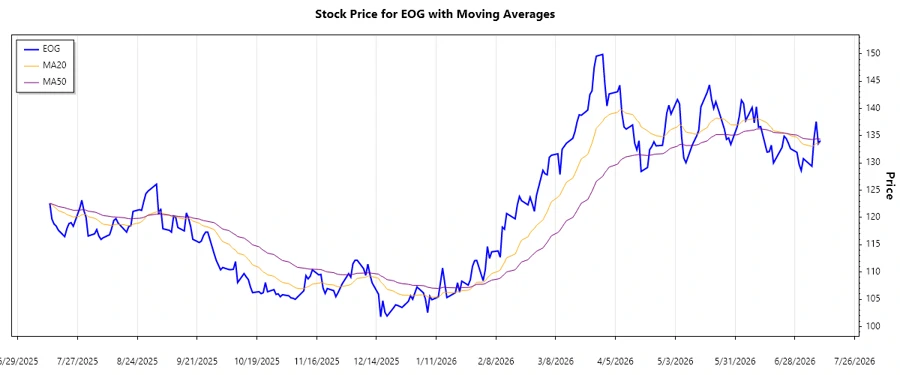
The trend analysis based on the last few months shows that EOG Resources' stock has experienced notable movements. By calculating the EMA20 and EMA50 from the closing prices, we identify the current trend direction. The results indicate the presence of a downward trend as evidenced by EMA20 being less than EMA50.
| Date | Closing Price | Trend |
|---|---|---|
| 2026-07-10 | 134.1 | ▼ |
| 2026-07-09 | 133.54 | ▼ |
| 2026-07-08 | 137.59 | ▲ |
| 2026-07-07 | 134.54 | ▲ |
| 2026-07-06 | 129.39 | ▼ |
| 2026-07-02 | 130.78 | ▲ |
| 2026-07-01 | 128.59 | ▼ |
The prevailing downward movement suggests caution for investors as the stock might continue experiencing downward pressure.
Support and Resistance
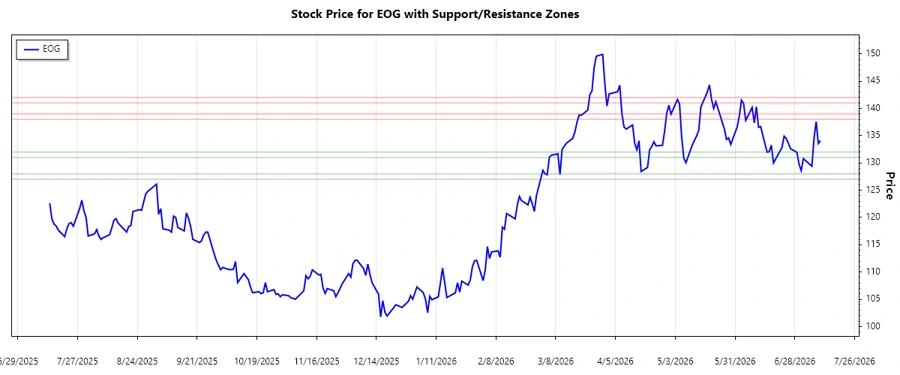
An assessment of the support and resistance zones has identified key price levels where the stock might reverse direction. These zones are crucial for anticipating potential market behavior.
| Zone Type | From | To |
|---|---|---|
| Support Zone 1 | 127.0 | 128.0 |
| Support Zone 2 | 131.0 | 132.0 |
| Resistance Zone 1 | 138.0 | 139.0 |
| Resistance Zone 2 | 141.0 | 142.0 |
The current stock price is within the Support Zone 2, indicating it may see potential support before testing resistance levels.
Conclusion
In conclusion, EOG Resources' stock performance reflects a current downward trend, with significant support and resistance zones identified. The support zones suggest potential stability, while resistance levels may challenge future climbs. Investors should weigh these technical factors in their trading strategy, considering EOG Resources’ industry position along with broader market indicators.
json These components are designed to integrate seamlessly into a comprehensive analysis, offering insights to investors and analysts through HTML and structured JSON data.
Smart Data Insight
Master the Perfect Entry & Exit for this Stock
Don't leave your profits to chance. Historically, this stock follows specific seasonal patterns that institutional traders use to maximize returns.
- ✅ Identify the "Golden Buying Window"
- ✅ Avoid high-risk correction cycles
- ✅ Backtested data from the last 20+ years