March 15, 2026 a 04:03 am

EOG: Trend and Support & Resistance Analysis - EOG Resources, Inc.
EOG Resources, Inc., a leading player in the oil and natural gas sector, has shown consistent growth in its stock price over the past few months. The company's focus on strategic locations like New Mexico and Texas contributes to its strong reserve base. With a substantial amount of crude oil and natural gas reserves, EOG is poised for potential expansions and market opportunities. As the industry dynamics fluctuate, EOG continues to maintain a resilient position in energy production.
Trend Analysis
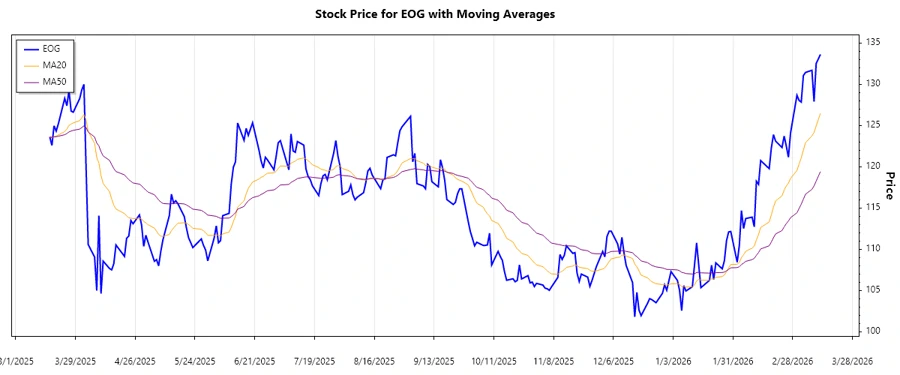
The analysis of the EOG stock based on the historical data suggests a fluctuating trend over the past months. Focusing on the last few weeks, we observe significant movement in stock prices, crucial in identifying the overall trend direction. The Exponential Moving Averages (EMA) for the 20-day and 50-day segments are crucial indicators of the trend. As of the latest observation, the EMA20 is consistently above the EMA50, indicating an ongoing ▲ upward trend which reflects a bullish momentum in the stock market.
| Date | Close Price | Trend |
|---|---|---|
| 2026-03-13 | $133.60 | ▲ Up |
| 2026-03-12 | $133.04 | ▲ Up |
| 2026-03-11 | $132.51 | ▲ Up |
| 2026-03-10 | $127.89 | ▲ Up |
| 2026-03-09 | $131.67 | ▲ Up |
| 2026-03-06 | $131.41 | ▲ Up |
| 2026-03-05 | $131.03 | ▲ Up |
Conclusively, the upward trend is confirmed by a consistent EMA20 above EMA50. This indicates continued investor confidence and potential for further growth. However, careful monitoring is advised as market conditions can evolve rapidly.
Support and Resistance
Analyzing the price action, we've identified key support and resistance zones, essential for understanding potential price reversals or continuations. Support levels provide a floor where buying interest is strong enough to overcome selling pressure, whereas resistance indicates a ceiling where selling pressures could overcome buying interest.
| Zone Type | From | To |
|---|---|---|
| ⬇ Support 1 | $126.10 | $128.00 |
| ⬇ Support 2 | $122.00 | $124.00 |
| ⬆ Resistance 1 | $135.00 | $137.00 |
| ⬆ Resistance 2 | $140.00 | $142.00 |
Currently, the price is approaching the first resistance zone, hinting at a possible restriction in upward movement unless there's a significant catalyst. This indicates potential profit-taking opportunities or hold strategies for investors.
Conclusion
In conclusion, EOG Resources, Inc. demonstrates a solid upward trend, supported by favorable EMA crossovers. The presence of defined support and resistance zones provides a comprehensive overview of potential market movements. While the bullish trend suggests growth prospects, investors should remain cautious of potential market shifts due to external economic conditions or sector-specific challenges. EOG's strong reserves and strategic locale offer resilience and opportunities in an evolving energy landscape. Continued monitoring is recommended to stay ahead of potential market changes and benefit from strategic investment opportunities.