August 31, 2025 a 02:03 pm


EOG: Trend and Support & Resistance Analysis - EOG Resources, Inc.
EOG Resources, Inc. remains a pivotal player in the energy sector, particularly in the exploration and production of crude oil and natural gas. With significant reserves primarily in New Mexico, Texas, and Trinidad & Tobago, EOG is strategically positioned to capitalize on the global demand for energy resources. Recent technical analysis suggests potential volatility, yet the long-term outlook remains promising given EOG's substantial reserves. Investors may find opportunities but should remain cautious given market fluctuations.
Trend Analysis
| Date | Close Price | Trend |
|---|---|---|
| 2025-08-29 | 124.82 | ▲ Up |
| 2025-08-28 | 124.34 | ▲ Up |
| 2025-08-27 | 122.88 | ▲ Up |
| 2025-08-26 | 121.3 | ▲ Up |
| 2025-08-25 | 121.43 | ▲ Up |
| 2025-08-22 | 121.11 | ▲ Up |
| 2025-08-21 | 118.51 | ▲ Up |
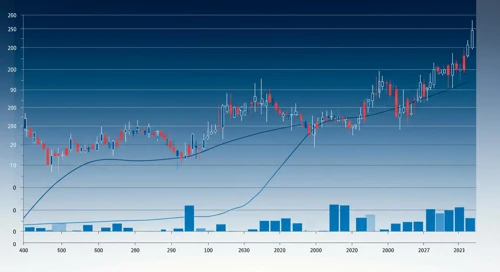
The recent price data shows a consistent upward trend in EOG's stock price over the past week. With EMA20 > EMA50, the stock is experiencing a clear ▲ Uptrend, indicating bullish momentum.
Support and Resistance
| Zone | Price Range |
|---|---|
| Support Zone 1 | ▼ 116.00 - 117.50 |
| Support Zone 2 | ▼ 114.00 - 115.00 |
| Resistance Zone 1 | ▲ 124.00 - 126.00 |
| Resistance Zone 2 | ▲ 128.00 - 130.00 |
The current price of 124.82 is within the Resistance Zone 1, suggesting a potential challenge in breaking above this range. However, successful penetration could lead to testing higher resistance levels.
Conclusion
Overall, EOG Resources, Inc. is demonstrating upward momentum, supported by strong fundamental reserves. The proximity to its resistance zone calls for cautious optimism, as breaking through could signify further upward potential. However, current resistance may also halt progress temporarily. Investors should weigh the opportunities in the energy sector against potential market volatility, maintaining a keen eye on macroeconomic influences.
Smart Data Insight
Master the Perfect Entry & Exit for this Stock
Don't leave your profits to chance. Historically, this stock follows specific seasonal patterns that institutional traders use to maximize returns.
- ✅ Identify the "Golden Buying Window"
- ✅ Avoid high-risk correction cycles
- ✅ Backtested data from the last 20+ years