August 12, 2025 a 02:03 pm

EOG: Trend and Support & Resistance Analysis - EOG Resources, Inc.
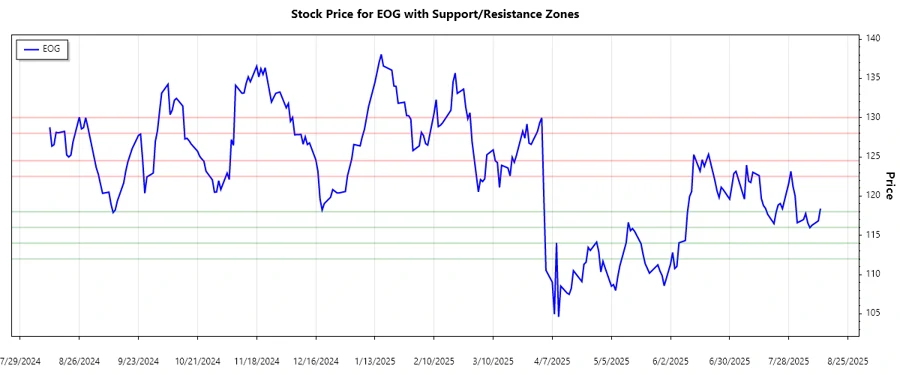
EOG Resources, Inc. showcases a stable position within the energy sector, focusing on crude oil and natural gas production primarily in Texas and New Mexico. Recently, the stock has been subject to market dynamics reflecting the strength of its resource base and operational efficiencies. Understanding technical levels such as support and resistance provides a comprehensive view for investors seeking opportunities in this energy giant.
Trend Analysis
| Date | Closing Price | Trend |
|---|---|---|
| 2025-08-12 | $118.4 | ▼ Downtrend |
| 2025-08-11 | $116.84 | ▼ Downtrend |
| 2025-08-08 | $116.28 | ▼ Downtrend |
| 2025-08-07 | $115.97 | ▼ Downtrend |
| 2025-08-06 | $116.59 | ▼ Downtrend |
| 2025-08-05 | $117.78 | ▼ Downtrend |
| 2025-08-04 | $117.01 | ▼ Downtrend |
The recent trend indicates a downward trajectory as observed from the EMA calculations. The EMA20 is consistently below the EMA50, reaffirming the current bearish sentiment for EOG. Such trends are crucial for traders anticipating further declines.
Support- and Resistance
| Zone Type | From | To |
|---|---|---|
| Resistance 1 | $122.5 ▲ | $124.5 ▲ |
| Resistance 2 | $128.0 ▲ | $130.0 ▲ |
| Support 1 | $116.0 ▼ | $118.0 ▼ |
| Support 2 | $112.0 ▼ | $114.0 ▼ |
Currently, the stock price is hovering near the support zone of $116.0 to $118.0, suggesting potential buying interest at these levels. However, should this support break, further declines could test lower levels.
Conclusion
EOG Resources, Inc. is currently in a bearish phase as reflected by both the trend analysis and support/resistance levels. There are notable risks if the price breaks below critical support zones, while opportunity exists if bullish momentum is regained. Analysts should monitor these technical levels to make informed decisions. Despite near-term volatility, EOG's fundamental position within the energy sector remains a critical consideration for long-term valuation.
Smart Data Insight
Master the Perfect Entry & Exit for this Stock
Don't leave your profits to chance. Historically, this stock follows specific seasonal patterns that institutional traders use to maximize returns.
- ✅ Identify the "Golden Buying Window"
- ✅ Avoid high-risk correction cycles
- ✅ Backtested data from the last 20+ years