
November 03, 2025 a 06:45 am
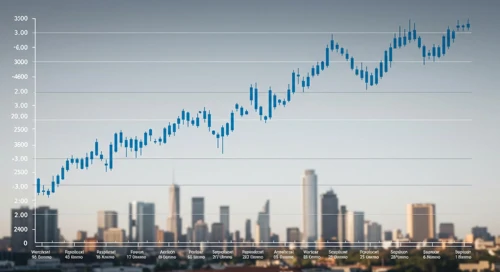

EOG: Fibonacci Analysis - EOG Resources, Inc.
EOG Resources, Inc., a prominent player in the oil and gas sector, has shown significant resilience in its stock performance. With vast proven reserves, especially in crude oil and natural gas liquids, the company's strategic operations in key locations like Texas and New Mexico ensure it remains a competitive force in the industry. Recent price movements exhibit a potential retracement, offering both challenges and opportunities for traders and investors.
Fibonacci Analysis
| Detail | Information |
|---|---|
| Trend Start Date | 2025-01-17 |
| Trend End Date | 2025-10-31 |
| High Price (Date) | $138.05 (2025-01-16) |
| Low Price (Date) | $105.84 (2025-10-31) |
| Fibonacci Level | Price Level |
|---|---|
| 0.236 | $110.86 |
| 0.382 | $114.03 |
| 0.5 | $116.95 |
| 0.618 | $119.87 |
| 0.786 | $124.02 |
The current price is around $105.84, which sits below the 0.236 retracement level. This suggests that the stock hasn't hit a significant Fibonacci retracement zone yet. Technically, this indicates potential for further decline unless a reversal or support at these levels is encountered, signaling caution for prospective buyers.
Conclusion
EOG Resources, Inc. faces both opportunities and challenges with the current market dynamics. The stock has not yet approached any major Fibonacci retracement levels, implying a cautious outlook for the near term. Investors should be mindful of the potential for further decline, but also consider the company's robust fundamentals and strategic reserve locations. Analysts see potential for stabilization if supportive price actions emerge, which could serve as a foundation for future growth or recovery. However, monitoring the broader oil market trends and economic indicators is crucial for making informed investment decisions.
Smart Data Insight
Master the Perfect Entry & Exit for this Stock
Don't leave your profits to chance. Historically, this stock follows specific seasonal patterns that institutional traders use to maximize returns.
- ✅ Identify the "Golden Buying Window"
- ✅ Avoid high-risk correction cycles
- ✅ Backtested data from the last 20+ years