October 26, 2025 a 03:15 pm

EOG: Fibonacci Analysis - EOG Resources, Inc.
EOG Resources, Inc. is a key player in the exploration and production of crude oil and natural gas. The company's operations are predominantly based in the United States, specifically in New Mexico and Texas. With estimated reserves of 3,747 million barrels of oil equivalent, EOG continues to be a significant entity in the energy market. Recent trends suggest fluctuations in the stock price that are crucial for technical analysis.
Fibonacci Analysis
| Details | Information |
|---|---|
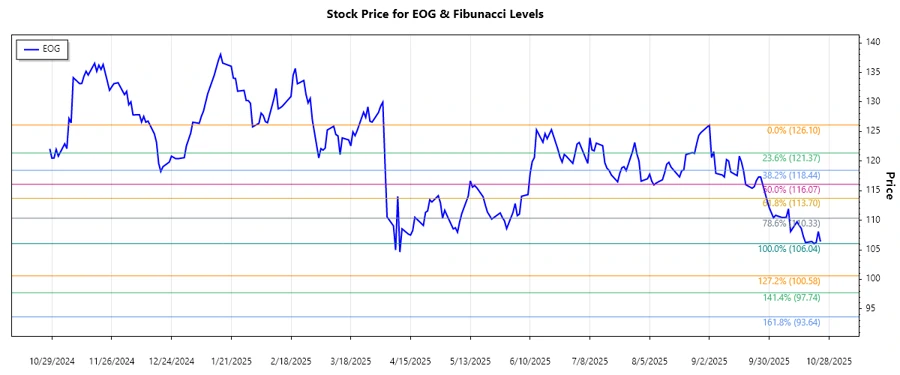
| Start Date | 2025-08-27 |
| End Date | 2025-10-24 |
| High Price | $126.10 on 2025-09-02 |
| Low Price | $106.04 on 2025-10-21 |
Fibonacci Retracement Levels
| Level | Price |
|---|---|
| 0.236 | $111.42 |
| 0.382 | $114.18 |
| 0.5 | $116.07 |
| 0.618 | $117.95 |
| 0.786 | $120.48 |
The current price of EOG is $106.38, which is below the 0.236 retracement zone, suggesting potential for future support between $106.04 and $111.42.
Conclusion
The data indicates that EOG's stock is in a downward trend recently finishing at $106.38, which could represent a potential for support around lower Fibonacci levels. While this might suggest an oversold condition, caution is advised as further downward momentum could occur. Long-term investors may find opportunities if support levels are confirmed and the stock rebounds. However, energy market fluctuations present risks that should be considered. Analysts will closely monitor these movements to assess market sentiment and adjust strategies accordingly.