May 02, 2026 a 02:46 am
EOG: Dividend Analysis - EOG Resources, Inc.
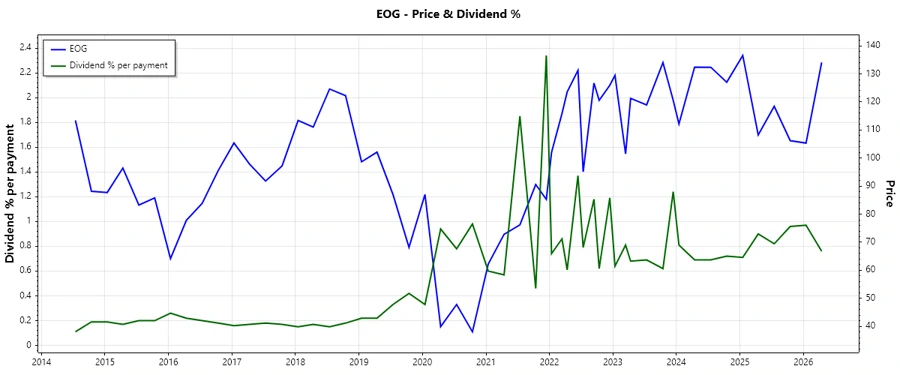
EOG Resources, Inc. stands out in the energy sector with a reliable dividend history, reflecting its long-term commitment to return capital to shareholders. Despite a challenging market environment, EOG's strategic focus on operational efficiency and shareholder value creation remains evident. With a dividend yield of 3.01% and a 37-year history of dividend payments, EOG showcases its resilience and reliability as a dividend-paying stock.
📊 Overview
EOG operates in the energy sector and has a notable dividend yield of 3.01%. The current dividend per share stands at 4.01 USD, showcasing a strong commitment to shareholder returns. Impressively, EOG has maintained a dividend history for 37 years, with no recent cuts or suspensions.
| Detail | Value |
|---|---|
| Sector | Energy |
| Dividend Yield | 3.01 % |
| Current Dividend Per Share | 4.01 USD |
| Dividend History | 37 years |
| Last Cut or Suspension | None |
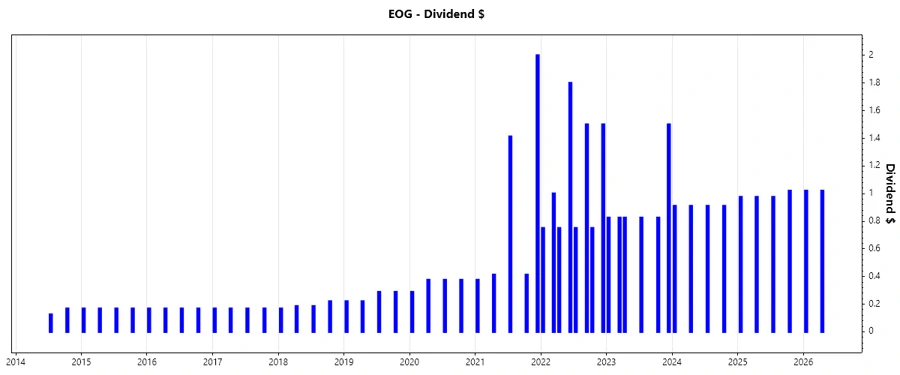
📈 Dividend History
EOG Resources' dividend history is a testament to its financial health and commitment to returning capital to shareholders. Maintaining a consistent dividend payout over decades not only reassures investors during economic fluctuations but also highlights EOG's strategic alignment with long-term shareholder value.
| Year | Dividend Per Share (USD) |
|---|---|
| 2026 | 2.04 |
| 2025 | 3.945 |
| 2024 | 3.64 |
| 2023 | 5.625 |
| 2022 | 8.80 |
📉 Dividend Growth
EOG's dividend growth provides insight into the company's potential for increasing shareholder returns. Analyzing the growth over 3 and 5-year periods indicates how well the company is able to enhance dividend payouts amidst operational dynamics.
| Time | Growth |
|---|---|
| 3 years | -0.23 % |
| 5 years | 0.23 % |
The average dividend growth is 0.23% over 5 years. This shows moderate but steady dividend growth.
✅ Payout Ratio
The payout ratio indicates how potentially sustainable the dividends are relative to company earnings. An appropriate balance ensures shareholders' return without compromising financial health.
| Key Figure | Ratio |
|---|---|
| EPS-based | 43.39 % |
| Free cash flow-based | 60.27 % |
The EPS-based payout ratio of 43.39% and the FCF-based ratio of 60.27% suggest EOG's dividends are within sustainable limits, balancing shareholder payouts with retained earnings for future growth.
💰 Cashflow & Capital Efficiency
Analyzing cash flow and capital efficiency provides insight into EOG's liquidity and ability to fund dividends from operations without additional leverage.
| Year | 2025 | 2024 | 2023 |
|---|---|---|---|
| Free Cash Flow Yield | 6.94% | 8.32% | 7.34% |
| Earnings Yield | 8.79% | 9.23% | 10.81% |
| CAPEX to Operating Cash Flow | 60.88% | 52.47% | 54.54% |
| Stock-based Compensation to Revenue | 0.96% | 0.85% | 0.76% |
| Free Cash Flow / Operating Cash Flow Ratio | 39.12% | 47.53% | 45.46% |
EOG's stable cash flows and capital efficiency ratios signify strong operational performance, ensuring cash can sustain both operational needs and rewarding shareholders.
📜 Balance Sheet & Leverage Analysis
Balance sheet metrics and leverage ratios highlight EOG's capital structure and debt management's soundness, essential for assessing financial resilience against economic downturns.
| Year | 2025 | 2024 | 2023 |
|---|---|---|---|
| Debt-to-Equity | 0.28 | 0.17 | 0.15 |
| Debt-to-Assets | 0.16 | 0.11 | 0.09 |
| Debt-to-Capital | 0.22 | 0.15 | 0.13 |
| Net Debt to EBITDA | 0.44 | -0.16 | -0.08 |
| Current Ratio | 1.92 | 2.10 | 2.44 |
| Quick Ratio | 1.64 | 1.91 | 2.13 |
| Financial Leverage | 1.74 | 1.61 | 1.56 |
EOG's prudent balance sheet management, characterized by low debt ratios and robust liquidity, signifies its robust financial standing to weather adverse conditions.
🏛 Fundamental Strength & Profitability
EOG's profitability and fundamental strength highlight management efficacy and the firm's competitive standing within its industry, essential for ongoing equitable shareholder distributions.
| Year | 2025 | 2024 | 2023 |
|---|---|---|---|
| Return on Equity | 16.69% | 21.82% | 27.03% |
| Return on Assets | 9.61% | 13.57% | 17.32% |
| Margins: Net | 22.07% | 27.39% | 32.76% |
| Margins: Gross | 68.11% | 75.70% | 78.66% |
| EBIT Margin | 29.07% | 35.74% | 42.43% |
| EBITDA Margin | 50.08% | 53.31% | 57.50% |
| Research & Development to Revenue | 0% | 0% | 0% |
Strong returns on equity and assets alongside expanding margins reflect EOG's operational excellence and sound strategic investments, underscoring its profitability and growth capacities.
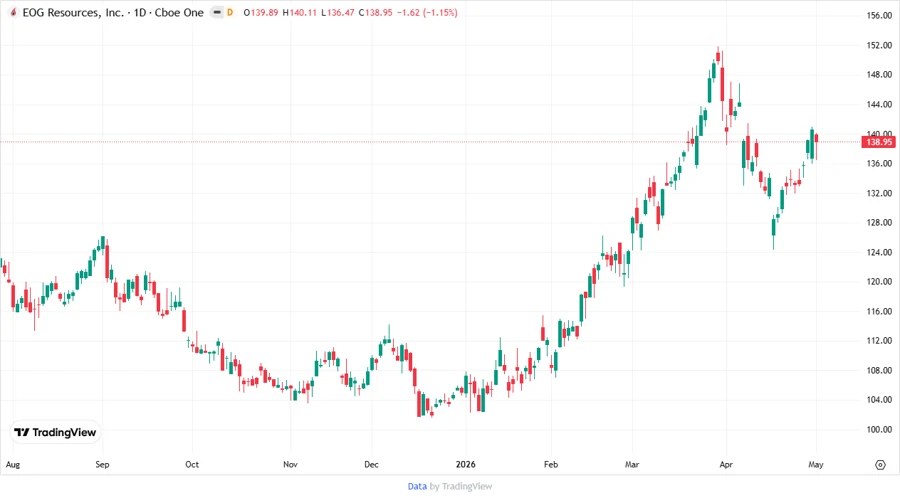
📉 Price Development
🗣️ Dividend Scoring System
| Category | Score | Score Bar |
|---|---|---|
| Dividend yield | 4/5 | |
| Dividend Stability | 5/5 | |
| Dividend growth | 3/5 | |
| Payout ratio | 4/5 | |
| Financial stability | 5/5 | |
| Dividend continuity | 5/5 | |
| Cashflow Coverage | 4/5 | |
| Balance Sheet Quality | 5/5 |
Overall Score: 35/40
⚠️ Rating
In conclusion, EOG Resources, Inc. presents a compelling dividend profile backed by substantial financial stability and a strong balance sheet. With high scores in stability and continuity, EOG remains a favorable investment for those seeking reliable income streams within the energy sector.
Smart Data Insight
Master the Perfect Entry & Exit for this Stock
Don't leave your profits to chance. Historically, this stock follows specific seasonal patterns that institutional traders use to maximize returns.
- ✅ Identify the "Golden Buying Window"
- ✅ Avoid high-risk correction cycles
- ✅ Backtested data from the last 20+ years