
July 24, 2026 a 11:44 am
EMR: Fibonacci Analysis - Emerson Electric Co.
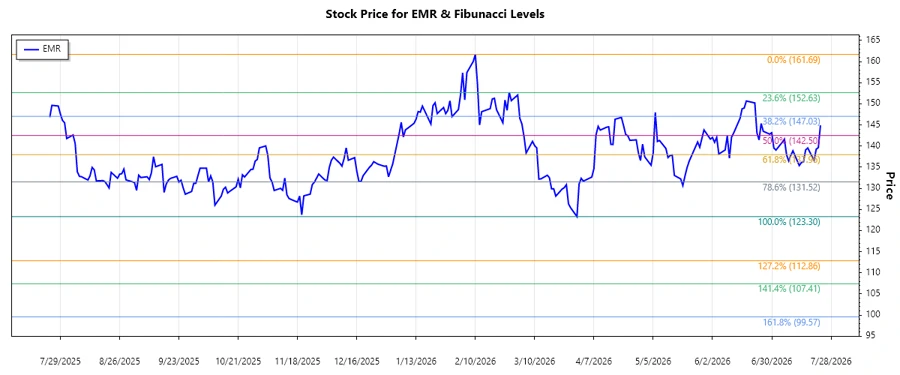
Emerson Electric Co. continues to demonstrate resilience in its sector with a well-diversified range of solutions across multiple segments. Recent stock performance has shown fluctuations, providing opportunities for technical analysis to forecast potential support and resistance levels. This analysis focuses on recent trends to outline possible future movements through Fibonacci retracement levels.
Fibonacci Analysis
| Parameter | Details |
|---|---|
| Trend Period | March 10, 2026 – July 23, 2026 |
| High Point | $161.69 on February 10, 2026 |
| Low Point | $123.30 on March 30, 2026 |
| Fibonacci Levels |
|
| Current Price Level | $144.90 - Within the 0.618 retracement zone |
| Technical Interpretation | The price is currently hovering around the 0.618 Fibonacci level, often considered a critical support zone. If prices hold above this level, a potential reversal upward can be anticipated. However, breaking below could indicate further downside risks. |
Conclusion
Emerson Electric Co. remains a stable player in the technology and engineering industry. The current market price positioning near crucial Fibonacci levels provides an intriguing outlook for traders. An upward trend continuation may hinge on holding above these key retracement levels, suggesting strong support. Conversely, failure to maintain these levels may signal caution and potential downside risk. Investors should monitor external factors that could influence market perceptions and stock valuations. Overall, continued focus on its core competencies and market expansions could help sustain growth and investor confidence.
Smart Data Insight
Master the Perfect Entry & Exit for this Stock
Don't leave your profits to chance. Historically, this stock follows specific seasonal patterns that institutional traders use to maximize returns.
- ✅ Identify the "Golden Buying Window"
- ✅ Avoid high-risk correction cycles
- ✅ Backtested data from the last 20+ years