
July 07, 2026 a 12:46 pm


EMR: Dividend Analysis - Emerson Electric Co.
Emerson Electric Co. is a strong player in the global market with a consistent dividend history of 55 years. Its dividend yield may not be the highest in its sector, but it's known for financial stability and commitment to returning value to shareholders. With no recent history of dividend cuts, Emerson presents a reliable income option.
📊 Overview
Emerson Electric Co. operates in the Industrial sector. The company maintains a dividend yield of 1.65%, which reflects a modest return based on the current share price. Its stable dividend history over 55 years highlights Emerson's commitment to shareholder returns. Importantly, there have been no recent suspensions or cuts to dividends, reinforcing the company's consistent performance.
| Detail | Value |
|---|---|
| Sector | Industrial |
| Dividend yield | 1.65 % |
| Current dividend per share | 2.12 USD |
| Dividend history | 55 years |
| Last cut or suspension | None |
🔍 Dividend History
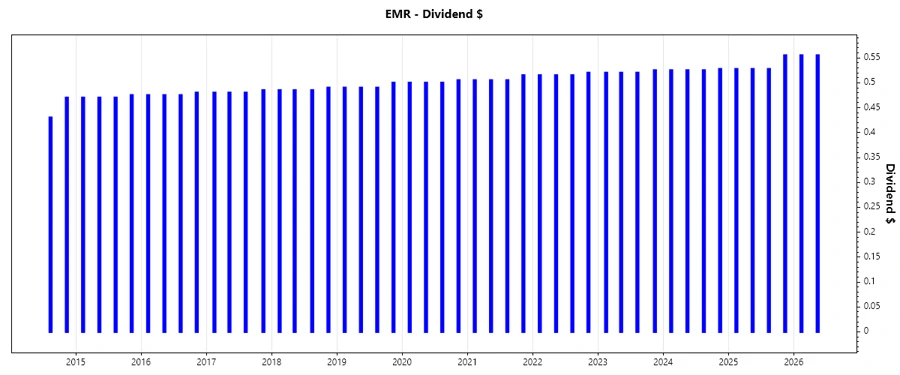
The dividend history of Emerson Electric Co. is a testament to its reliability. Maintaining and gradually increasing dividends over time demonstrates stability. This long history is crucial for income-focused investors.
| Year | Dividend per Share (USD) |
|---|---|
| 2026 | 1.11 |
| 2025 | 2.14 |
| 2024 | 2.10 |
| 2023 | 2.09 |
| 2022 | 2.07 |
📈 Dividend Growth
Though the root of equity growth lies in the reinvestment and prudent financial management of a company, analyzing dividend growth complements the broader picture. Emerson Electric Co. has seen a 3-year growth of 1.16% and a 5-year growth of 1.29% in dividends, exhibiting steady, albeit modest, growth rates.
| Time | Growth |
|---|---|
| 3 years | 1.16 % |
| 5 years | 1.29 % |
The average dividend growth is 1.29% over 5 years. This shows moderate but steady dividend growth.
💡 Payout Ratio
The payout ratios provide insight into what portion of earnings and free cash flow is returned to shareholders as dividends. With an EPS payout ratio of 48.58% and a free cash flow payout ratio of 38.08%, Emerson maintains a balanced approach, ensuring sustainable dividends while allowing room for reinvestments.
| Key figure | Ratio |
|---|---|
| EPS-based | 48.58 % |
| Free cash flow-based | 38.08 % |
Both payout ratios are indicative of a stable financial status and ability to continue dividends while supporting future growth initiatives.
💰 Cashflow & Capital Efficiency
By analyzing cash flow and capital efficiency, investors can assess operational health. Emerson's free cash flow yield and high earnings yield represent operational stability and capital efficiency. Meanwhile, rational CAPEX to operating cash flow underlines efficiency in capital expenditure.
| Year | 2025 | 2024 | 2023 |
|---|---|---|---|
| Free Cash Flow Yield | 3.61% | 4.66% | 0.49% |
| Earnings Yield | 3.11% | 3.15% | 23.84% |
| CAPEX to Operating Cash Flow | 13.91% | 12.58% | 56.99% |
| Stock-based Compensation to Revenue | 1.46% | 1.49% | 1.65% |
| Free Cash Flow / Operating Cash Flow Ratio | 86.09% | 87.42% | 43.01% |
The consistent earnings yield and positive free cash flow underscore Emerson's ability to generate cash efficiently, supporting sustained dividend payouts and future capital investments.
📊 Balance Sheet & Leverage Analysis
Understanding Emerson Electric Co.'s leverage and balance sheet robustness is crucial for assessing financial stability and risk. The company maintains moderate debt levels as evidenced by its debt ratios, with an ability to cover interest payments comfortably.
| Year | 2025 | 2024 | 2023 |
|---|---|---|---|
| Debt-to-Equity | 0.68 | 0.39 | 0.41 |
| Debt-to-Assets | 0.33 | 0.19 | 0.20 |
| Debt-to-Capital | 0.40 | 0.28 | 0.29 |
| Net Debt to EBITDA | 2.52 | 1.18 | 0.12 |
| Current Ratio | 0.87 | 1.77 | 2.75 |
| Quick Ratio | 0.65 | 1.40 | 2.35 |
| Financial Leverage | 2.07 | 2.05 | 2.07 |
Emerson's balance sheet shows a conservative debt strategy, appropriate liquidity ratios, and strong leverage management, all indicative of sound financial health.
🧮 Fundamental Strength & Profitability
Examining fundamental strengths provides insight into how effectively a company converts revenue into profit. Emerson Electric Co.'s various margin indicators and returns showcase robust operational efficiency as well as significant profitability.
| Year | 2025 | 2024 | 2023 |
|---|---|---|---|
| Return on Equity | 11.31% | 9.10% | 63.89% |
| Return on Assets | 5.46% | 4.45% | 30.92% |
| Net Margin | 12.73% | 11.25% | 87.17% |
| EBIT Margin | 18.43% | 13.39% | 20.86% |
| EBITDA Margin | 26.86% | 23.05% | 27.79% |
| Gross Margin | 52.84% | 50.79% | 48.97% |
| Research & Development to Revenue | 0.00% | 0.00% | 0.00% |
In terms of profitability, Emerson demonstrates a solid performance across key metrics, underscoring its operational effectiveness and lucrative position within its industry.
📉 Price Development
🔍 Dividend Scoring System
This scoring system evaluates Emerson Electric Co. across multiple dimensions of dividend quality, offering investors a comprehensive understanding of its overall dividend performance.
| Criterion | Score | |
|---|---|---|
| Dividend yield | 2 | |
| Dividend Stability | 5 | |
| Dividend growth | 3 | |
| Payout ratio | 4 | |
| Financial stability | 4 | |
| Dividend continuity | 5 | |
| Cashflow Coverage | 4 | |
| Balance Sheet Quality | 4 |
Overall Score: 31/40
✅ Rating
Overall, Emerson Electric Co. showcases a solid dividend investment profile. While the yield may not be the most compelling in the industry, its long dividend history, remarkable stability, and strong financial foundation reinforce its attractiveness as a steady income investment. This stock may appeal to investors prioritizing consistency and low-risk returns over high immediate yields.
Smart Data Insight
Master the Perfect Entry & Exit for this Stock
Don't leave your profits to chance. Historically, this stock follows specific seasonal patterns that institutional traders use to maximize returns.
- ✅ Identify the "Golden Buying Window"
- ✅ Avoid high-risk correction cycles
- ✅ Backtested data from the last 20+ years