June 22, 2026 a 12:46 pm
EMR: Dividend Analysis - Emerson Electric Co.
Emerson Electric Co., a well-established player in the industrial sector, offers a stable and lucrative dividend profile. The company's consistent dividend payout over the last 55 years highlights its commitment to shareholder returns. Its current dividend yield is modest, but provides a long-standing history of reliability for income-focused investors.
📊 Overview
Emerson Electric operates in the industrial sector, renowned for its innovation and market leadership. The current dividend yield stands at 1.65%, with a dividend per share of 2.12 USD. The firm boasts a remarkable 55 years of consecutive dividend history, with no recent cuts or suspensions, demonstrating its robust financial health and commitment to shareholder value.
| Key Metric | Value |
|---|---|
| Sector | Industrial |
| Dividend yield | 1.65% |
| Current dividend per share | 2.12 USD |
| Dividend history | 55 years |
| Last cut or suspension | None |
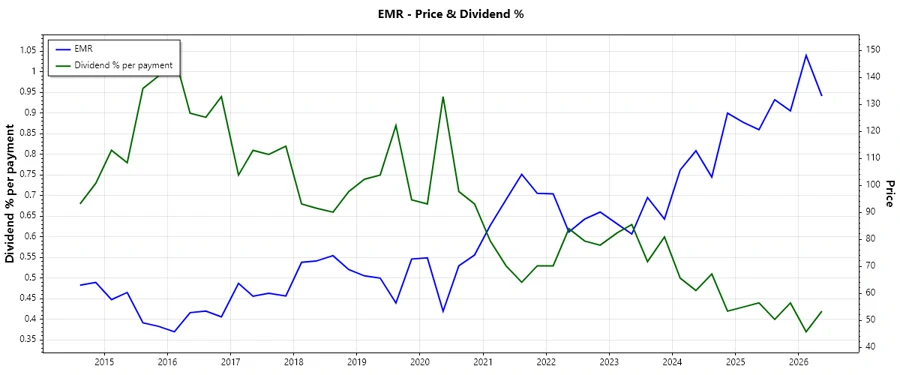
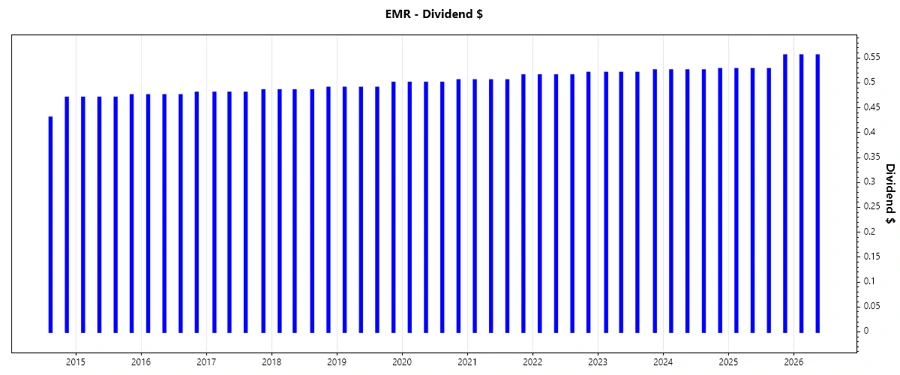
🗣️ Dividend History
The dividend history of a company is a critical indicator of its financial stability and reliability for investors seeking regular income. Emerson Electric's record of uninterrupted dividend payments over decades establishes a foundation of trust.
| Year | Dividend per Share (USD) |
|---|---|
| 2026 | 1.11 |
| 2025 | 2.1375 |
| 2024 | 2.1025 |
| 2023 | 2.0850 |
| 2022 | 2.0650 |
📈 Dividend Growth
Analyzing the dividend growth provides insights into a company's ability to increase shareholder returns over time. Emerson Electric's growth rates suggest a stable yet cautious approach to enhancing dividend payouts.
| Time | Growth |
|---|---|
| 3 years | 1.16% |
| 5 years | 1.29% |
The average dividend growth is 1.29% over 5 years. This shows moderate but steady dividend growth.
✅ Payout Ratio
Payout ratios indicate the proportion of earnings and free cash flow distributed as dividends. Emerson's ratios reflect a balanced approach, preserving capital for growth while rewarding shareholders.
| Key figure ratio | Value |
|---|---|
| EPS-based | 48.58% |
| Free cash flow-based | 38.08% |
The EPS-based payout ratio of 48.58% and the FCF-based payout ratio of 38.08% suggest a healthy balance between retaining earnings for growth and providing returns to shareholders.
⚠️ Cashflow & Capital Efficiency
Cashflow and capital efficiency metrics are essential for assessing a firm's operational success and long-term viability. Emerson's figures suggest effective capital management, ensuring adequate liquidity and efficient asset utilization.
| Metric | 2025 | 2024 | 2023 |
|---|---|---|---|
| Free Cash Flow Yield | 3.61% | 4.66% | 0.49% |
| Earnings Yield | 3.11% | 3.15% | 23.84% |
| CAPEX to Operating Cash Flow | 13.91% | 12.58% | 56.99% |
| Stock-based Compensation to Revenue | 1.46% | 1.49% | 1.65% |
| Free Cash Flow / Operating Cash Flow Ratio | 86.09% | 87.42% | 43.01% |
Emerson's free cash flow yield and cash conversion ratios indicate solid cash flow stability, supporting sustainable dividend payouts and strategic investments.
📉 Balance Sheet & Leverage Analysis
The leverage and liquidity metrics provide insight into a company's financial resilience and ability to manage debt. Emerson demonstrates a balanced financial structure with manageable leverage ratios.
| Metric | 2025 | 2024 | 2023 |
|---|---|---|---|
| Debt-to-Equity | 0.68 | 0.39 | 0.41 |
| Debt-to-Assets | 0.33 | 0.19 | 0.20 |
| Debt-to-Capital | 0.40 | 0.28 | 0.29 |
| Net Debt to EBITDA | 2.39 | 1.18 | 0.12 |
| Current Ratio | 0.87 | 1.77 | 2.75 |
| Quick Ratio | 0.65 | 1.39 | 2.35 |
| Financial Leverage | 2.07 | 2.05 | 2.07 |
Emerson's balance sheet ratios reflect strong financial health, indicating efficient capital allocation and potential for debt reduction.
✅ Fundamental Strength & Profitability
These metrics assess the overall efficiency and profitability of utilizing equity and assets. Emerson shows substantial operational success with strong returns on equity and assets.
| Metric | 2025 | 2024 | 2023 |
|---|---|---|---|
| Return on Equity | 11.31% | 9.10% | 63.89% |
| Return on Assets | 5.46% | 4.45% | 30.92% |
| Net Margin | 12.73% | 11.25% | 87.17% |
| EBIT Margin | 18.43% | 13.39% | 20.86% |
| EBITDA Margin | 26.86% | 23.05% | 27.79% |
| Gross Margin | 52.84% | 50.79% | 48.97% |
| R&D to Revenue | 0% | 0% | 0% |
With exemplary margins and returns, Emerson exhibits exceptional profitability, driven by its strategic focus on operational efficiency and cost management.
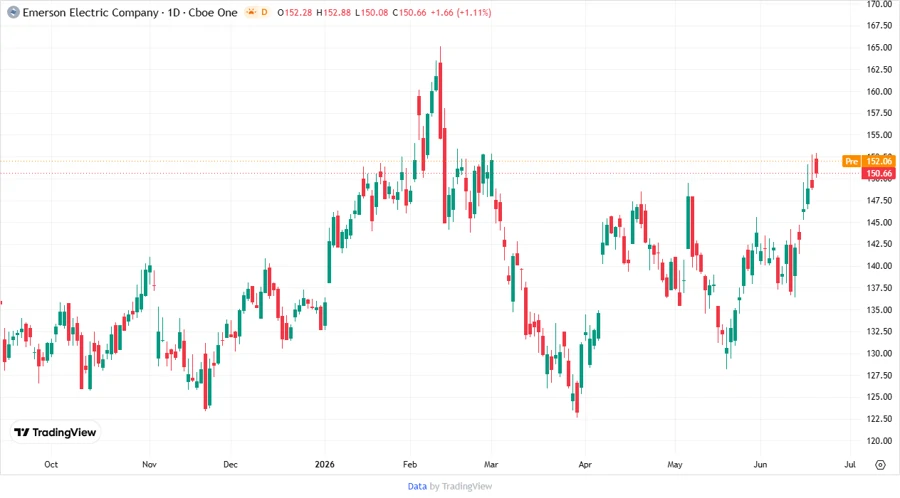
📈 Price Development
🏆 Dividend Scoring System
| Category | Score | Score Bar |
|---|---|---|
| Dividend yield | 3 | |
| Dividend Stability | 5 | |
| Dividend growth | 3 | |
| Payout ratio | 4 | |
| Financial stability | 5 | |
| Dividend continuity | 5 | |
| Cashflow Coverage | 4 | |
| Balance Sheet Quality | 5 |
Overall Score: 34/40
✅ Rating
Emerson Electric Co. earns a robust dividend rating, reflecting its steadfast commitment to shareholder returns, financial stability, and efficient capital management. The company's long-standing history of dividend payments and strategic investment in growth make it a reliable choice for dividend-focused investors.
Smart Data Insight
Master the Perfect Entry & Exit for this Stock
Don't leave your profits to chance. Historically, this stock follows specific seasonal patterns that institutional traders use to maximize returns.
- ✅ Identify the "Golden Buying Window"
- ✅ Avoid high-risk correction cycles
- ✅ Backtested data from the last 20+ years