April 25, 2026 a 03:31 pm


EMR: Dividend Analysis - Emerson Electric Co.
Emerson Electric Co. has a robust dividend profile, characterized by a long dividend history and stable growth. Their commitment to consistent payouts over 55 years highlights their financial resilience. With a diversified industrial portfolio, Emerson remains a compelling choice for dividend investors seeking steady income.
📊 Overview
The following table provides a snapshot of Emerson Electric Co.'s dividend-related metrics:
| Detail | Value |
|---|---|
| Sector | Industrials |
| Dividend Yield | 1.46% |
| Current Dividend per Share | 2.12 USD |
| Dividend History | 55 years |
| Last Cut or Suspension | None |
🗣️ Dividend History
Emerson's dividend consistency over 55 years demonstrates financial stability and dedication to shareholder returns. Long histories like theirs promote investor confidence.
| Year | Dividend per Share (USD) |
|---|---|
| 2026 | 0.555 |
| 2025 | 2.1375 |
| 2024 | 2.1025 |
| 2023 | 2.085 |
| 2022 | 2.065 |
📈 Dividend Growth
Analyzing Emerson's dividend growth provides insights into their future payout potential. Incremental increases can signify sound financial health.
| Time | Growth |
|---|---|
| 3 years | 1.16% |
| 5 years | 1.29% |
The average dividend growth is 1.29% over 5 years. This shows moderate but steady dividend growth.
📉 Payout Ratio
Payout ratios indicate how much of the earnings and free cash flows are distributed as dividends, a crucial factor for dividend sustainability.
| Key Figure | Ratio |
|---|---|
| EPS-based | 51.47% |
| Free cash flow-based | 46.25% |
The ratios suggest a balanced approach, with the company having room for dividend payouts without overstretching financially.
✅ Cashflow & Capital Efficiency
A strong cash flow and capital efficiency position are vital indicators of how well a company can sustain its dividend payments.
| Key Metric | 2025 | 2024 | 2023 |
|---|---|---|---|
| Free Cash Flow Yield | 3.61% | 4.66% | 0.49% |
| Earnings Yield | 3.11% | 3.15% | 23.84% |
| CAPEX to Operating Cash Flow | 14.74% | 12.58% | 56.98% |
| Stock-based Compensation to Revenue | 1.37% | 1.49% | 1.65% |
| Free Cash Flow / Operating Cash Flow Ratio | 86.09% | 87.42% | 43.01% |
The current metrics reflect a strong capacity to manage capital efficiently, which supports dividend payments.
⚠️ Balance Sheet & Leverage Analysis
Understanding leverage ratios helps assess the financial risk and long-term sustainability of a company's operations.
| Metric | 2025 | 2024 | 2023 |
|---|---|---|---|
| Debt-to-Equity | 0.678 | 0.386 | 0.414 |
| Debt-to-Assets | 0.328 | 0.189 | 0.200 |
| Debt-to-Capital | 0.404 | 0.279 | 0.293 |
| Net Debt to EBITDA | 2.52 | 1.18 | 0.12 |
| Current Ratio | 0.876 | 1.775 | 2.746 |
| Quick Ratio | 0.650 | 1.395 | 2.348 |
| Financial Leverage | 2.069 | 2.045 | 2.066 |
Emerson Electric appears to maintain a healthy balance sheet with adequate liquidity and controlled leverage, although the debt declined notably from 2023 to 2025.
🌟 Fundamental Strength & Profitability
Metrics on profitability and sustainability are important as they relate directly to a company's ability to sustain dividends.
| Metric | 2025 | 2024 | 2023 |
|---|---|---|---|
| Return on Equity | 11.31% | 9.10% | 63.89% |
| Return on Assets | 5.46% | 4.45% | 30.92% |
| Net Margin | 12.73% | 11.25% | 87.17% |
| EBIT Margin | 18.43% | 13.39% | 20.86% |
| EBITDA Margin | 26.86% | 23.05% | 27.79% |
| Gross Margin | 52.84% | 50.79% | 48.97% |
The impressive profitability ratios, especially the substantial rise in 2023, point towards solid operational performance and an efficient capital use.
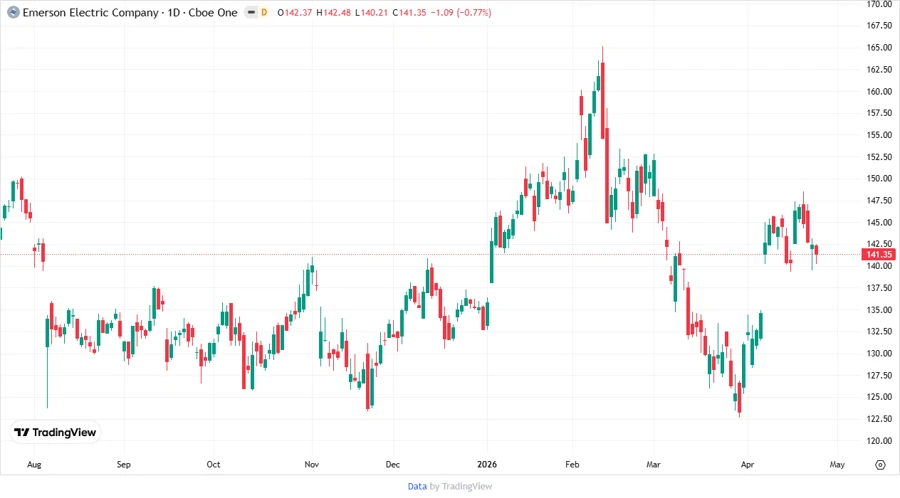
📉 Price Development
💡 Dividend Scoring System
| Criteria | Score | |
|---|---|---|
| Dividend yield | 3 | |
| Dividend Stability | 5 | |
| Dividend growth | 3 | |
| Payout ratio | 4 | |
| Financial stability | 4 | |
| Dividend continuity | 5 | |
| Cashflow Coverage | 4 | |
| Balance Sheet Quality | 4 |
Overall Score: 32/40
🗳️ Rating
Emerson Electric Co. presents a solid investment for those seeking stable dividend returns. With a long history of consistent payouts and a strong financial position, it stands out in the industrial sector. Their dividends appear sustainable under current economic conditions, making Emerson Electric Co. a recommended buy for dividend-oriented investors.
Smart Data Insight
Master the Perfect Entry & Exit for this Stock
Don't leave your profits to chance. Historically, this stock follows specific seasonal patterns that institutional traders use to maximize returns.
- ✅ Identify the "Golden Buying Window"
- ✅ Avoid high-risk correction cycles
- ✅ Backtested data from the last 20+ years