March 07, 2026 a 11:31 am


EMR: Dividend Analysis - Emerson Electric Co.
Emerson Electric Co. has firmly upheld its status as a staple in the dividend investor community. With a reliable track record of 55 years of dividend history and consistent growth in dividend payouts, the company resonates well with income-focused investors. Its robust financial metrics and sound capital management strategies suggest a strong potential for sustainable dividend payouts. However, investors should be mindful of slight decreases in growth rates and market volatilities impacting yields.
📊 Overview
Emerson Electric Co. operates within the industrial sector, known for its stable returns and long-term growth prospects. Despite a modest dividend yield of 1.46%, the current dividend per share stands at approximately 2.10 USD. The company's impressive dividend continuity over 55 years underscores its commitment to shareholder value. Notably, there has been no recent dividend cut or suspension.
| Sector | Dividend Yield | Current Dividend per Share | Dividend History | Last Cut/Suspension |
|---|---|---|---|---|
| Industrial | 1.46% | 2.10 USD | 55 years | None |
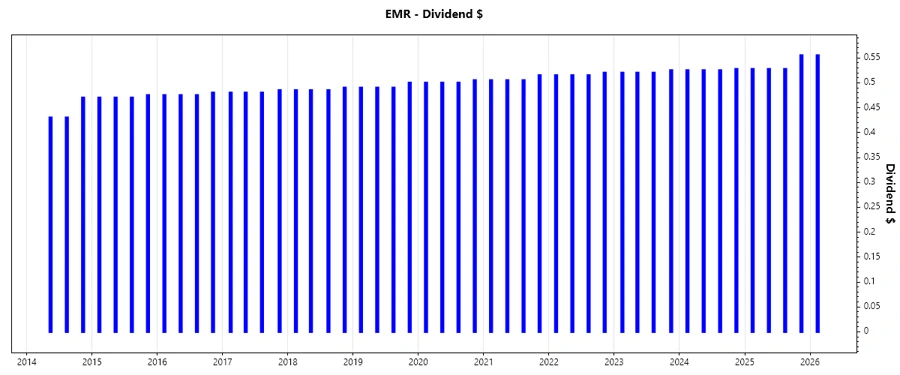
🗣️ Dividend History
Maintaining a consistent dividend history is critical for investor confidence. Emerson's record of uninterrupted dividend growth over the past decades exemplifies its reliability. This history serves as a testament to the company's ability to generate sustainable earnings and cash flows necessary for dividend payments.
| Year | Dividend per Share (USD) |
|---|---|
| 2026 | 0.555 |
| 2025 | 2.1375 |
| 2024 | 2.1025 |
| 2023 | 2.085 |
| 2022 | 2.065 |
📈 Dividend Growth
The growth of dividends by 0.0129% over five years, though modest, indicates Emerson's commitment to steady payout increases. Reliable growth patterns reflect well-managed business operations capable of converting profits into shareholder returns.
| Time | Growth |
|---|---|
| 3 years | 0.01% |
| 5 years | 0.01% |
The average dividend growth is approximately 0.01% over 5 years. This shows moderate but steady dividend growth.
⚠️ Payout Ratio
The payout ratio gauges the sustainability of dividends. Emerson's EPS-based payout ratio of 51.09% and FCF-based ratio of 45.93% signal a manageable distribution level, ensuring buffer room for earnings variations.
| Key Figure Ratio | Value |
|---|---|
| EPS-based | 51.09% |
| Free cash flow-based | 45.93% |
The EPS and FCF payout ratios reveal a conservative payout strategy, which favors dividend sustainability amid fluctuating earnings.
✅ Cashflow & Capital Efficiency
| Year | 2025 | 2024 | 2023 |
|---|---|---|---|
| Free Cash Flow Yield | 3.59% | 4.66% | 0.49% |
| Earnings Yield | 3.08% | 3.15% | 23.84% |
| CAPEX to Operating Cash Flow | 13.91% | 12.58% | 56.99% |
| Stock-based Compensation to Revenue | 1.46% | 1.49% | 1.65% |
| Free Cash Flow / Operating Cash Flow Ratio | 86.09% | 87.42% | 43.01% |
Emerson's cash flow efficiency underscores robust capital allocation, reflecting on its free cash flow yield. This ensures operational resiliency and financial agility.
📊 Balance Sheet & Leverage Analysis
| Year | 2025 | 2024 | 2023 |
|---|---|---|---|
| Debt-to-Equity | 0.678 | 0.386 | 0.414 |
| Debt-to-Assets | 0.328 | 0.189 | 0.200 |
| Debt-to-Capital | 0.404 | 0.279 | 0.293 |
| Net Debt to EBITDA | 2.51 | 1.18 | 0.12 |
| Current Ratio | 0.876 | 1.775 | 2.746 |
| Quick Ratio | 0.650 | 1.395 | 2.348 |
| Financial Leverage | 2.069 | 2.045 | 2.066 |
Emerson's stable ratios denote a well-managed leverage strategy, ensuring liquidity and reduced risk from debt obligations, crucial for ongoing dividend commitments.
🧠 Fundamental Strength & Profitability
| Year | 2025 | 2024 | 2023 |
|---|---|---|---|
| Return on Equity | 11.31% | 9.10% | 63.89% |
| Return on Assets | 5.46% | 4.45% | 30.92% |
| Margins: Net | 12.73% | 11.25% | 87.17% |
| Margins: EBIT | 17.60% | 13.39% | 20.86% |
| Margins: EBITDA | 27.98% | 23.05% | 27.79% |
| Margins: Gross | 52.84% | 50.79% | 48.97% |
| Research & Development to Revenue | 0% | 0% | 0% |
Strong fundamentals and profitability, as exhibited in Emerson’s returns and margins, emphasize business efficiency and a solid foundation for future growth and dividends.
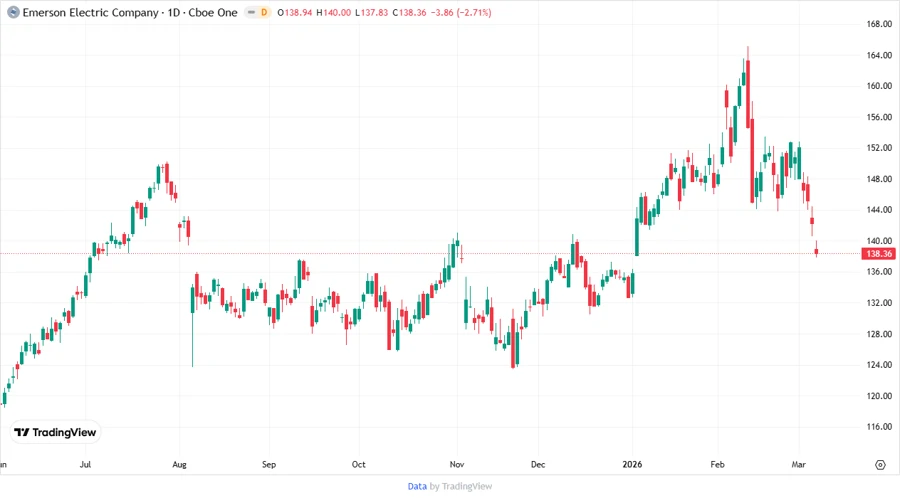
📉 Price Development
🔍 Dividend Scoring System
| Criteria | Rating | Score |
|---|---|---|
| Dividend yield | 3/5 | |
| Dividend Stability | 5/5 | |
| Dividend Growth | 3/5 | |
| Payout Ratio | 4/5 | |
| Financial Stability | 4/5 | |
| Dividend Continuity | 5/5 | |
| Cashflow Coverage | 4/5 | |
| Balance Sheet Quality | 4/5 |
Total Score: 32/40
🏁 Rating
Emerson Electric Co. stands as a stalwart in dividend stocks, achieving an overall impressive rating in dividend consistency, financial stability, and cash flow adequacy. While the yield appears modest, its stability and growth prospects promise future investor returns. Hence, Emerson presents a sound choice for conservative dividend-seeking portfolios.
Smart Data Insight
Master the Perfect Entry & Exit for this Stock
Don't leave your profits to chance. Historically, this stock follows specific seasonal patterns that institutional traders use to maximize returns.
- ✅ Identify the "Golden Buying Window"
- ✅ Avoid high-risk correction cycles
- ✅ Backtested data from the last 20+ years