October 17, 2025 a 07:46 am

EMR: Dividend Analysis - Emerson Electric Co.
Emerson Electric Co. (EMR) has demonstrated robust dividend growth over the years, making it a reliable choice for income-focused investors. With a 54-year track record of dividend payments, the company shows commitment to returning value to shareholders. However, the current dividend yield of 1.60% may not appeal to investors seeking higher income. EMR's conservative payout ratios signify a strong financial footing, suggesting a sustainable dividend policy moving forward.
Overview
Emerson Electric Co. operates in the industrial sector, providing a range of innovative automated solutions. With a current dividend yield of 1.60% and an impressive 54-year dividend payment history, the company maintains its reputation as a reliable dividend payer. The absence of recent dividend cuts or suspensions highlights the stability of EMR's dividend policy.
| Detail | Value |
|---|---|
| Sector | Industrial |
| Dividend Yield | 1.60% |
| Current Dividend per Share | $2.10 |
| Dividend History | 54 years |
| Last Cut or Suspension | None |
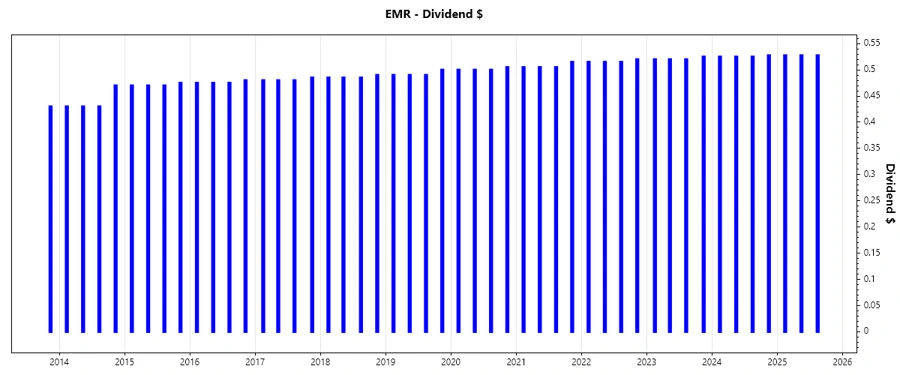
Dividend History
Emerson Electric Co.'s dividend history is a testament to its financial resilience and shareholder commitment. Maintaining and increasing dividends over decades reflects the company's steady cash flow and prudent management practices.
| Year | Dividend Per Share (USD) |
|---|---|
| 2025 | 1.5825 |
| 2024 | 2.1025 |
| 2023 | 2.0850 |
| 2022 | 2.0650 |
| 2021 | 2.0300 |
Dividend Growth
Dividend growth is a key indicator of a company's financial health and its ability to increase shareholder value. Emerson Electric Co.'s dividend growth over the last 3 and 5 years is modest, yet consistent.
| Time | Growth |
|---|---|
| 3 years | 1.18% |
| 5 years | 1.31% |
The average dividend growth is 1.31% over 5 years. This shows moderate but steady dividend growth.
Payout Ratio
The payout ratio is essential in assessing sustainability of dividends. Emerson Electric Co. maintains a prudent approach with a payout ratio based on EPS at 44.56%, and based on free cash flow at 43.16%, reflecting strong profitability and cash flow generation.
| Key figure | Ratio |
|---|---|
| EPS-based | 44.56% |
| Free cash flow-based | 43.16% |
The company's EPS payout ratio of 44.56% and FCF payout ratio of 43.16% indicate a well-balanced approach to maintaining liquidity while rewarding shareholders.
Cashflow & Capital Efficiency
Analyzing cash flow and capital efficiency offers insights into a company's operational effectiveness and ability to fund dividends. Emerson Electric Co. demonstrates solid free cash flow generation relative to its operating cash flow, indicating robust cash management capabilities.
| Year | Free Cash Flow Yield | Earnings Yield | CAPEX to Operating Cash Flow | Stock-based Compensation to Revenue | Free Cash Flow / Operating Cash Flow Ratio |
|---|---|---|---|---|---|
| 2024 | 4.66% | 3.15% | 12.58% | 1.49% | 87.42% |
| 2023 | 0.49% | 3.88% | 56.99% | 1.65% | 43.01% |
| 2022 | 5.51% | 6.32% | 18.17% | 0.91% | 81.83% |
EMR's cash flow profile underscores operational efficiency, with high operating cash conversion and moderate capital investment proportional to cash flow, indicating effective business management.
Balance Sheet & Leverage Analysis
Evaluating leverage and balance sheet strength is crucial in understanding financial stability and risk levels. Emerson Electric Co. records a healthy debt-to-equity ratio with strong interest coverage, suggesting manageable leverage and solid liquidity.
| Year | Debt-to-Equity | Debt-to-Assets | Debt-to-Capital | Net Debt to EBITDA | Current Ratio | Quick Ratio | Financial Leverage |
|---|---|---|---|---|---|---|---|
| 2024 | 0.38 | 0.19 | 0.27 | 1.14 | 1.77 | 1.40 | 2.05 |
| 2023 | 0.41 | 0.20 | 0.29 | 0.13 | 2.75 | 2.35 | 2.07 |
| 2022 | 1.03 | 0.30 | 0.51 | 2.54 | 1.09 | 0.87 | 3.44 |
Overall, EMR sustains balance sheet health with cautious leverage, supported by adequate liquidity ratios that enhance financial flexibility and reduce risk exposure.
Fundamental Strength & Profitability
Analyzing fundamental strength and profitability ratios provides key insights into a firm’s competitive positioning and profit efficiency. Emerson Electric Co. exhibits steady ROE and ROA along with favorable profit margins, underscoring operational effectiveness.
| Year | Return on Equity | Return on Assets | Net Margin | EBIT Margin | EBITDA Margin | Gross Margin | Research & Development to Revenue |
|---|---|---|---|---|---|---|---|
| 2024 | 9.10% | 4.45% | 11.25% | 13.39% | 23.05% | 44.58% | 4.46% |
| 2023 | 10.40% | 5.03% | 14.19% | 19.69% | 26.62% | 45.50% | 3.45% |
| 2022 | 26.49% | 7.70% | 19.88% | 19.27% | 25.37% | 42.95% | 2.79% |
EMR's profitability metrics reveal efficient resource utilization and a strategic focus on sustaining competitive advantages, thereby contributing to long-term growth potential.
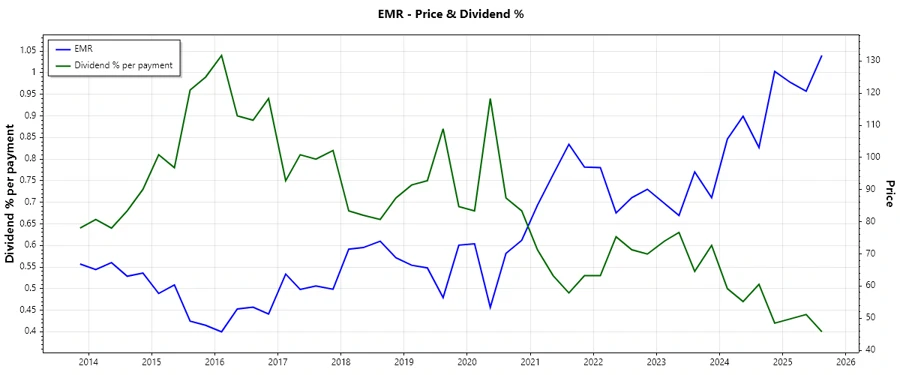
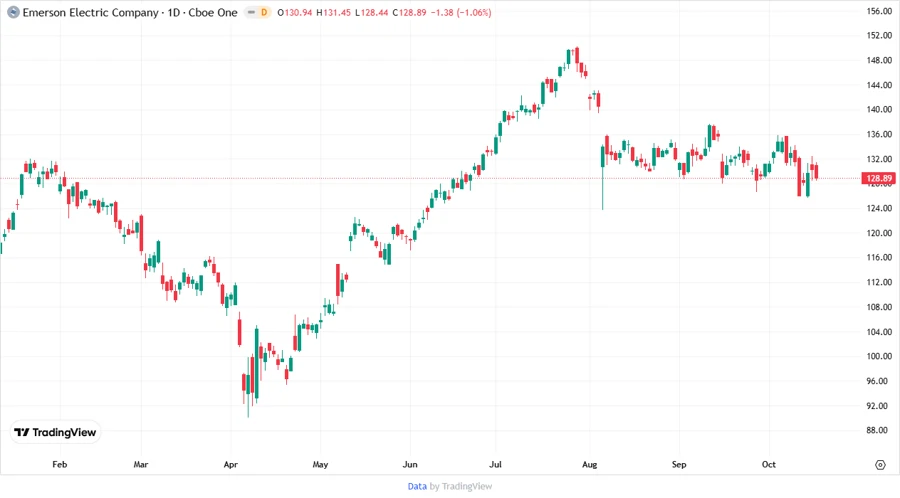
Price Development
Dividend Scoring System
| Criterion | Score | Score-Bar |
|---|---|---|
| Dividend yield | 3/5 | |
| Dividend Stability | 5/5 | |
| Dividend growth | 3/5 | |
| Payout ratio | 4/5 | |
| Financial stability | 4/5 | |
| Dividend continuity | 5/5 | |
| Cashflow Coverage | 4/5 | |
| Balance Sheet Quality | 4/5 |
Total Score: 32/40
Rating
Emerson Electric Co. stands out as a strong candidate for investors seeking reliable dividend income and stable growth potential. Despite a modest yield, its impeccable dividend history and financial discipline make it a well-rounded choice. Investors should consider EMR for its solid operational performance and promising long-term outlook. Therefore, it holds a 'BUY' rating for conservative dividend investors.
Smart Data Insight
Master the Perfect Entry & Exit for this Stock
Don't leave your profits to chance. Historically, this stock follows specific seasonal patterns that institutional traders use to maximize returns.
- ✅ Identify the "Golden Buying Window"
- ✅ Avoid high-risk correction cycles
- ✅ Backtested data from the last 20+ years