August 28, 2025 a 12:47 pm

EMR: Dividend Analysis - Emerson Electric Co.
Emerson Electric Co. stands as a stalwart in dividend sustainability with an impressive 54-year streak of uninterrupted payouts. Its moderate yield of 1.60% may not attract yield investors, but the company's robust financial metrics showcase a commitment to gradual dividend growth. With substantial coverage ratios and a prudent payout strategy, Emerson Electric exemplifies a balanced approach to capital allocation, potentially rewarding patient shareholders.
📊 Overview
| Sector | Dividend Yield (%) | Current Dividend per Share (USD) | Dividend History (Years) | Last Cut or Suspension |
|---|---|---|---|---|
| Industrial Goods | 1.60% | 2.10 USD | 54 | None |
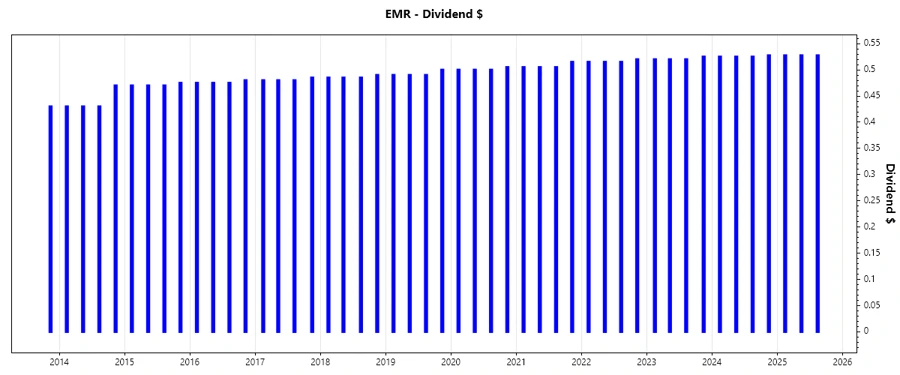
🗣️ Dividend History
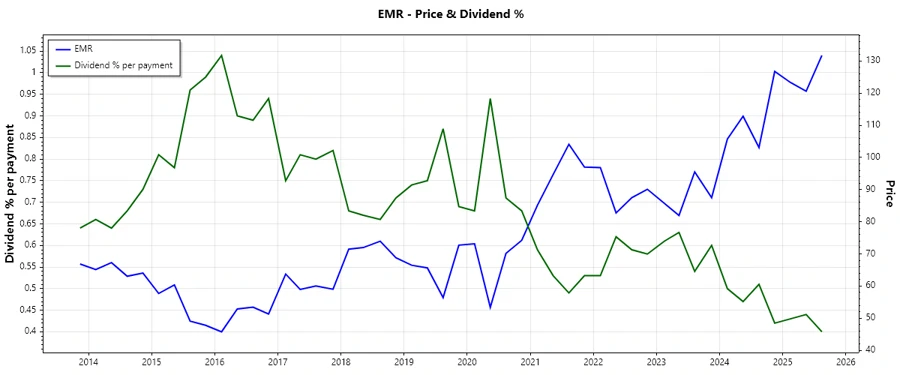
Emerson Electric Co.'s dividend history showcases more than half a century of consistency, an impressive feat that underscores its commitment to returning capital to shareholders. Steady dividend growth is vital for income-focused investors seeking reliability in earnings through various market cycles.
| Year | Dividend per Share (USD) |
|---|---|
| 2025 | 1.5825 |
| 2024 | 2.1025 |
| 2023 | 2.085 |
| 2022 | 2.065 |
| 2021 | 2.030 |
📈 Dividend Growth
The growth trajectory of Emerson's dividends over both three and five-year spans is indicative of slow, yet consistent appreciation. Such gradual growth rates are favorable in signaling the sustainability of future earnings expansion without overextending the company's financial capabilities.
| Time | Growth (%) |
|---|---|
| 3 years | 1.18% |
| 5 years | 1.31% |
The average dividend growth is 1.31% over 5 years. This shows moderate but steady dividend growth.
✅ Payout Ratio
Payout ratios are critical in assessing a company's financial discipline in balancing dividend payments with earnings and cash flow generation. A moderately low payout ratio allows for buffer against earnings volatility and room for dividend increases.
| Key Figure | Ratio (%) |
|---|---|
| EPS-based | 44.56% |
| Free cash flow-based | 43.16% |
The 44.56% payout ratio based on EPS and 43.16% based on FCF suggest solid coverage, indicating a sustainable level of dividend payments without straining financial resources.
✅ Cashflow & Capital Efficiency
The examination of cash flows and capital efficiency provides insight into a corporation’s ability to generate free cash flow after covering operating and capital expenditures. This capability is essential for supporting dividend payouts and ensuring operational stability.
| Key Metrics | 2024 | 2023 | 2022 |
|---|---|---|---|
| Free Cash Flow Yield | 4.66% | 0.49% | 5.51% |
| Earnings Yield | 3.15% | 3.88% | 6.32% |
| CAPEX to Operating Cash Flow | 12.57% | 56.99% | 18.17% |
| Stock-based Compensation to Revenue | 1.49% | 1.65% | 0.91% |
| Free Cash Flow / Operating Cash Flow Ratio | 87.42% | 43.01% | 81.83% |
The consistent free cash flow yield and controlled CAPEX spending confirm effective capital management strategies that uphold dividend commitments.
✅ Balance Sheet & Leverage Analysis
Analyzing debt levels and leverage ratios sheds light on Emerson's financial risk profile and its capacity to service financial obligations, ensuring long-term stability and operational flexibility.
| Key Ratios | 2024 | 2023 | 2022 |
|---|---|---|---|
| Debt-to-Equity | 0.38 | 0.41 | 1.03 |
| Debt-to-Assets | 0.19 | 0.20 | 0.30 |
| Debt-to-Capital | 0.27 | 0.29 | 0.51 |
| Net Debt to EBITDA | 1.14 | 0.13 | 2.54 |
| Current Ratio | 1.77 | 2.75 | 1.09 |
| Quick Ratio | 1.40 | 2.35 | 0.87 |
The solid debt-to-equity and other leverage indicators highlight prudent financial management, reinforcing Emerson's position as a resilient dividend payer.
✅ Fundamental Strength & Profitability
Reviewing the core profit metrics offers insights into Emerson’s operational effectiveness and profitability longevity, essential for sustaining and improving dividend yields.
| Metrics | 2024 | 2023 | 2022 |
|---|---|---|---|
| Return on Equity | 9.10% | 10.40% | 26.49% |
| Return on Assets | 4.45% | 5.03% | 7.70% |
| Net Profit Margin | 11.25% | 14.19% | 19.88% |
| EBIT Margin | 13.40% | 19.69% | 19.27% |
| EBITDA Margin | 23.05% | 26.62% | 25.37% |
| Gross Profit Margin | 44.58% | 45.50% | 42.95% |
| R&D to Revenue | 0% | 3.45% | 2.79% |
Sustained high return metrics and profitability indicators affirm Emerson's operational efficiency and capital utilization, pointing to enduring dividend safety.
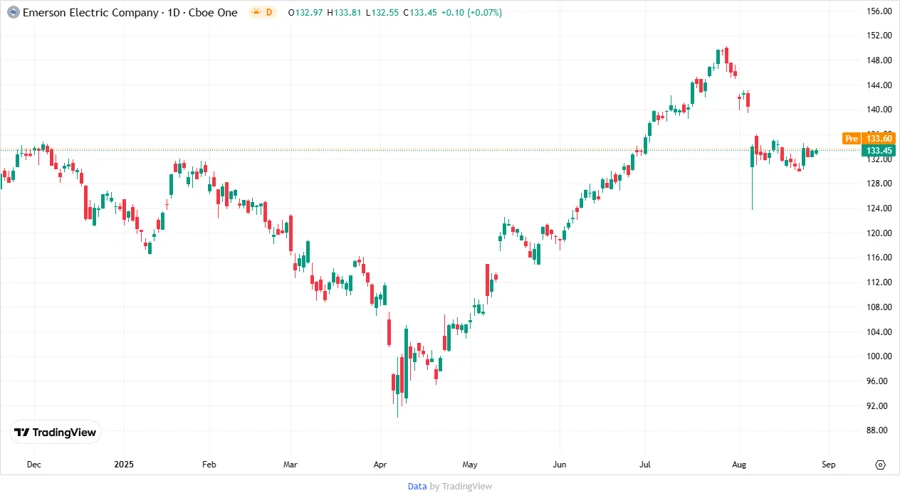
📉 Price Development
📈 Dividend Scoring System
| Criteria | Score | Score Bar |
|---|---|---|
| Dividend Yield | 3 | |
| Dividend Stability | 5 | |
| Dividend Growth | 3 | |
| Payout Ratio | 4 | |
| Financial Stability | 4 | |
| Dividend Continuity | 5 | |
| Cashflow Coverage | 4 | |
| Balance Sheet Quality | 4 |
Total Score: 32/40
📊 Rating
Emerson Electric Co. delivers a robust dividend offering underpinned by a consistent track record of payouts, solid financial stability, and efficient capital management. While the current dividend yield is modest, its reliable growth and comprehensive coverage make it a solid choice for income investors prioritizing stability and long-term potential over immediate high yields. We recommend Emerson as a 'Buy' for those seeking a stable, gradually growing income stream.
Smart Data Insight
Master the Perfect Entry & Exit for this Stock
Don't leave your profits to chance. Historically, this stock follows specific seasonal patterns that institutional traders use to maximize returns.
- ✅ Identify the "Golden Buying Window"
- ✅ Avoid high-risk correction cycles
- ✅ Backtested data from the last 20+ years