October 23, 2025 a 03:31 am

EMN: Dividend Analysis - Eastman Chemical Company
Eastman Chemical Company presents an intriguing dividend profile with a steady yield and a consistent history of payments. With a healthy dividend yield of over 5%, it remains an attractive option for income-focused investors. The company has maintained a commendable dividend history of 32 years, signaling reliability. However, investors should tread cautiously due to the high payout ratio relative to free cash flow.
📊 Overview
Eastman Chemical Company operates within the chemical sector, providing a generous dividend yield of 5.10%. This is complemented by a current dividend per share of $3.25. With an impressive 32-year dividend history, it reflects a robust financial foundation and commitment to returning value to shareholders. The absence of any recent dividend cuts or suspensions further emphasizes stability.
| Key Metric | Detail |
|---|---|
| Sector | Chemical |
| Dividend Yield | 5.10% |
| Current Dividend Per Share | $3.25 |
| Dividend History | 32 years |
| Last Cut or Suspension | None |
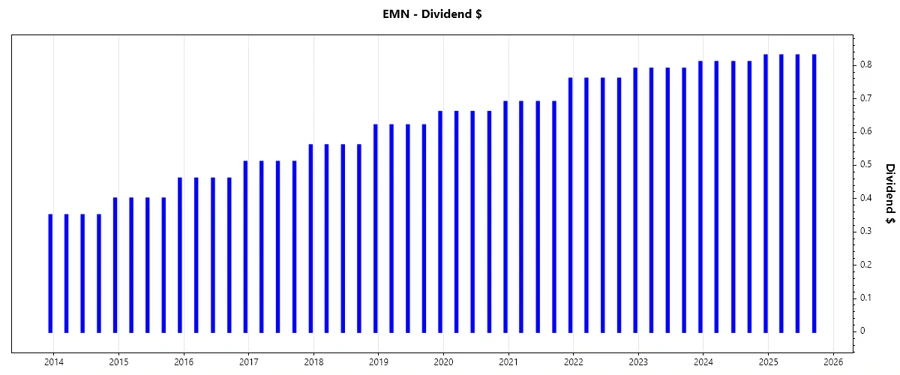
🔍 Dividend History
Historically, Eastman Chemical Company’s dividends have portrayed robust continuity, mirroring stable financial health and commitment to shareholders. This historical consistency is crucial as it underpins investor confidence in long-term income investments.
| Year | Dividend Per Share (USD) |
|---|---|
| 2025 | 2.49 |
| 2024 | 3.26 |
| 2023 | 3.18 |
| 2022 | 3.07 |
| 2021 | 2.83 |
📈 Dividend Growth
The dividend growth highlights Eastman Chemical’s strategy of sustainable improvements. Over the last 3 years, growth has been moderate, which is essential for maintaining long-term payout capabilities and investor satisfaction.
| Time | Growth |
|---|---|
| 3 years | 4.83% |
| 5 years | 5.28% |
The average dividend growth is 5.28% over 5 years. This shows moderate but steady dividend growth.
⚖️ Payout Ratio
The payout ratios reflect Eastman Chemical’s balance between maintaining sufficient earnings for operational growth and rewarding shareholders. High EPS and FCF-based payout ratios may indicate potential constraints on future growth if earnings and cash flows do not improve.
| Key Figure | Ratio |
|---|---|
| EPS-based | 44.89% |
| Free cash flow-based | 91.18% |
Despite a manageable EPS-based payout ratio, the free cash flow-based ratio of 91.18% suggests a more strained position, which could limit agility in dividend increases or capital investments.
💡 Cashflow & Capital Efficiency
Eastman Chemical's cash flow metrics are crucial for evaluating its ability to sustain dividends and reinvest in growth. The free cash flow yield and capital efficiency ratios provide insights into the company’s cash generation relative to its market valuation and operational activities.
| Metric | 2024 | 2023 | 2022 |
|---|---|---|---|
| Free Cash Flow Yield | 6.46% | 5.13% | 3.62% |
| Earnings Yield | 8.49% | 8.39% | 7.88% |
| CAPEX to Operating Cash Flow | 46.54% | 60.26% | 62.67% |
| Stock-based Compensation to Revenue | 0% | 0% | 0% |
| Free Cash Flow / Operating Cash Flow Ratio | 53.46% | 39.74% | 37.33% |
The healthy earnings yield and strategic capex allocation support a resilient cash flow model. However, the lower free cash flow conversion may impose limitations on potential growth investments.
💪 Balance Sheet & Leverage Analysis
Analyzing balance sheet strengths and leverage ratios is essential for assessing Eastman Chemical’s financial health and ability to service its obligations. Key metrics such as debt-to-equity and current ratios indicate the company’s financial leverage and liquidity position.
| Metric | 2024 | 2023 | 2022 |
|---|---|---|---|
| Debt-to-Equity | 0.868 | 0.910 | 1.000 |
| Debt-to-Assets | 33.0% | 33.9% | 35.1% |
| Debt-to-Capital | 46.5% | 47.6% | 50.0% |
| Net Debt to EBITDA | 2.32 | 2.44 | 2.85 |
| Current Ratio | 1.51 | 1.35 | 1.16 |
| Quick Ratio | 0.78 | 0.70 | 0.58 |
| Financial Leverage | 2.63 | 2.68 | 2.85 |
Stable debt metrics and adequate liquidity ratios indicate sound financial stability, though vigilance on leverage trends is prudent given the evolving market conditions.
🏦 Fundamental Strength & Profitability
Metrics such as Return on Equity (ROE) and profit margins reflect Eastman Chemical's profitability and operational efficiency. These are crucial in determining the company’s capacity to generate returns on shareholder investments and to sustain competitive advantages.
| Metric | 2024 | 2023 | 2022 |
|---|---|---|---|
| Return on Equity | 15.66% | 16.38% | 15.39% |
| Return on Assets | 5.95% | 6.11% | 5.41% |
| Net Margin | 9.65% | 9.72% | 7.53% |
| EBIT Margin | 13.77% | 14.23% | 11.00% |
| EBITDA Margin | 19.20% | 19.65% | 15.53% |
| Gross Margin | 24.86% | 22.42% | 19.52% |
| R&D to Revenue | 2.86% | 2.60% | 2.51% |
The consistent ROE and healthy margins underline Eastman Chemical's profitability prowess, suggesting effective cost control and market positioning.
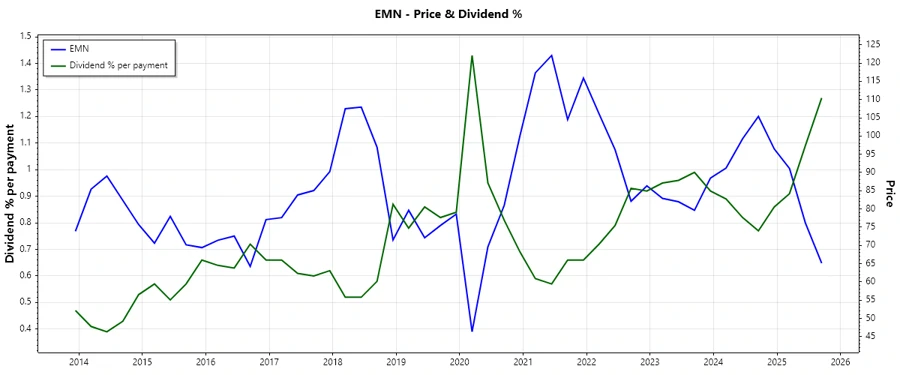
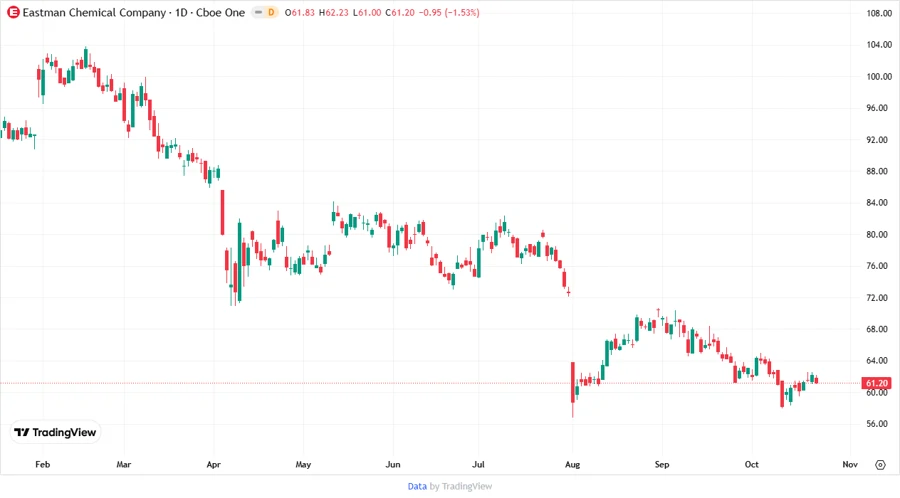
📉 Price Development
🏅 Dividend Scoring System
| Category | Score | Bar |
|---|---|---|
| Dividend yield | 4 | |
| Dividend Stability | 5 | |
| Dividend growth | 3 | |
| Payout ratio | 3 | |
| Financial stability | 4 | |
| Dividend continuity | 5 | |
| Cashflow Coverage | 3 | |
| Balance Sheet Quality | 4 |
Total Score: 31/40
🔮 Rating
The overall assessment of Eastman Chemical Company positions it as a fundamentally stable dividend payor with a strong ability to maintain its dividend through financial resilience and conservatively-managed finances. However, caution is advised due to the near-stretched free cash flow ratios, which might constrain future dividend growth. Recommended for investors seeking stable and reliable dividend income.
Smart Data Insight
Master the Perfect Entry & Exit for this Stock
Don't leave your profits to chance. Historically, this stock follows specific seasonal patterns that institutional traders use to maximize returns.
- ✅ Identify the "Golden Buying Window"
- ✅ Avoid high-risk correction cycles
- ✅ Backtested data from the last 20+ years