June 14, 2025 a 07:31 am
EMN: Dividend Analysis - Eastman Chemical Company
Eastman Chemical Company, with its extensive 32-year dividend history, stands out as a strong contender in the chemical sector. With a current dividend yield of 4.33%, it provides a reliable income stream for investors. Despite a moderate 5-year dividend growth rate of 5.28%, the company's consistent record without any recent cuts or suspensions adds to its attractiveness.
Overview 📊
Eastman Chemical Company, operating within the chemical sector, has a profound impact on the industry. Here's a snapshot of the company's dividend-related data:
| Metric | Details |
|---|---|
| Sector | Chemical |
| Dividend Yield | 4.33% |
| Current Dividend per Share | 3.25 USD |
| Dividend History | 32 years |
| Last Cut or Suspension | None |
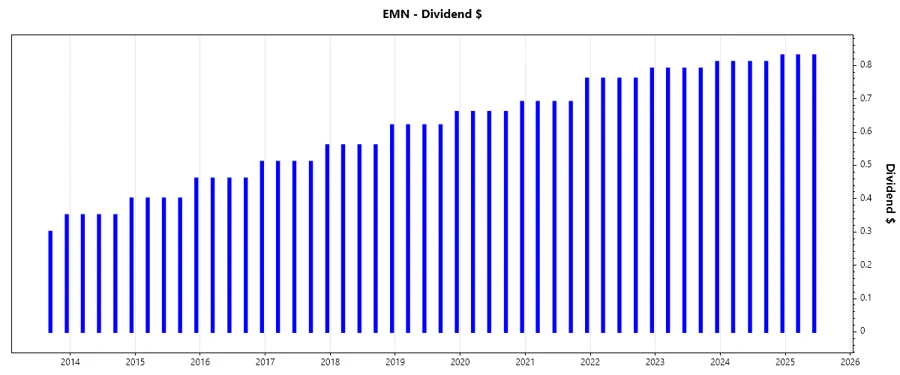
Dividend History 📈
The consistent dividend payments over the years have built investor confidence and signify a stable financial standing. The resilience in dividend payments highlights the company's ability to generate steady cash flows and its commitment to shareholder returns.
| Year | Dividend per Share (USD) |
|---|---|
| 2025 | 1.66 |
| 2024 | 3.26 |
| 2023 | 3.18 |
| 2022 | 3.07 |
| 2021 | 2.83 |
Dividend Growth 📈
Monitoring the growth in dividends is critical as it reflects the company's earnings growth and financial health. The growth rates over the last 3 and 5 years are indicative of future cash distribution capabilities.
| Time | Growth |
|---|---|
| 3 years | 4.83% |
| 5 years | 5.28% |
The average dividend growth is 5.28% over 5 years. This shows moderate but steady dividend growth.
Payout Ratio 🗣️
The payout ratio is a vital metric determining the sustainability of dividends. Analyzing both EPS-based and Free Cash Flow-based ratios offers insights into dividend coverage by earnings and cash flows.
| Key Figure | Ratio |
|---|---|
| EPS-based | 41.11% |
| Free Cash Flow-based | 65.10% |
With an EPS-based payout ratio of 41.11% and an FCF-based payout ratio of 65.10%, Eastman Chemical maintains a balanced approach, ensuring dividends are well-covered by both earnings and cash flows.
Cashflow & Capital Efficiency 📉
Assessments of cash flows and capital efficiency indicate the company's ability to generate future cash flows and efficiently use its capital for growth.
| Year | 2024 | 2023 | 2022 |
|---|---|---|---|
| Free Cash Flow Yield | 6.46% | 5.08% | 3.16% |
| Earnings Yield | 8.49% | 8.39% | 7.13% |
| CAPEX to Operating Cash Flow | 46.54% | 60.63% | 64.00% |
| Stock-based Compensation to Revenue | 2.67% | 2.59% | 2.49% |
| Free Cash Flow / Operating Cash Flow Ratio | 53.46% | 39.37% | 36.00% |
The company's cash flow metrics over recent years reveal stable cash flow generation and efficient capital allocation, crucial for sustaining future dividends and growth projects.
Balance Sheet & Leverage Analysis 🗣️
An analysis of the balance sheet reveals how effectively a company manages its financial obligations and leverages to generate profits.
| Year | 2024 | 2023 | 2022 |
|---|---|---|---|
| Debt-to-Equity | 0.87 | 0.91 | 1.00 |
| Debt-to-Assets | 0.33 | 0.34 | 0.35 |
| Debt-to-Capital | 0.46 | 0.48 | 0.50 |
| Net Debt to EBITDA | 2.32 | 2.44 | 2.69 |
| Current Ratio | 1.71 | 1.35 | 1.16 |
| Quick Ratio | 0.78 | 0.70 | 0.58 |
| Financial Leverage | 2.63 | 2.68 | 2.85 |
Eastman’s balance sheet shows a careful balance of debt and equity. Despite a slight leverage increase, the company remains financially stable.
Fundamental Strength & Profitability 🗣️
Key profit metrics provide insights into the company's ability to generate earnings relative to revenue, assets, and equity.
| Year | 2024 | 2023 | 2022 |
|---|---|---|---|
| Return on Equity | 15.66% | 16.38% | 15.39% |
| Return on Assets | 5.95% | 6.11% | 5.41% |
| Margins: Net | 9.65% | 9.71% | 7.50% |
| Margins: EBIT | 13.79% | 14.25% | 11.01% |
| Margins: EBITDA | 19.19% | 19.62% | 16.36% |
| Margins: Gross | 24.41% | 22.38% | 20.20% |
| Research & Development to Revenue | 2.75% | 2.60% | 2.50% |
Eastman Chemical Company's profitability remains robust, with high levels of return on equity and healthy profit margins, reflecting effective cost management and competitive positioning.
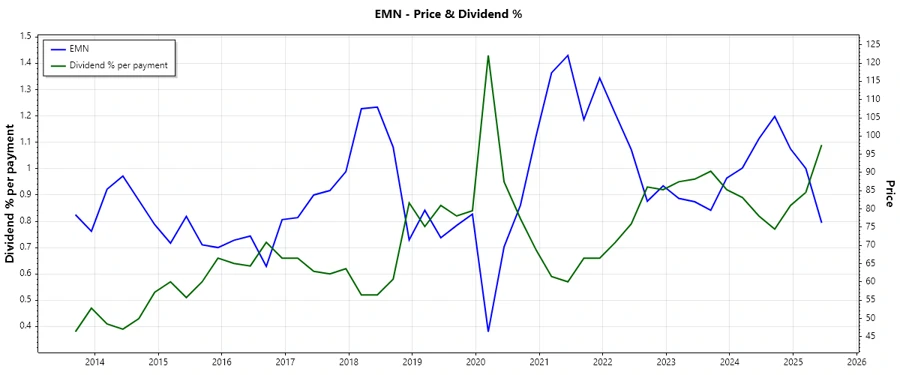
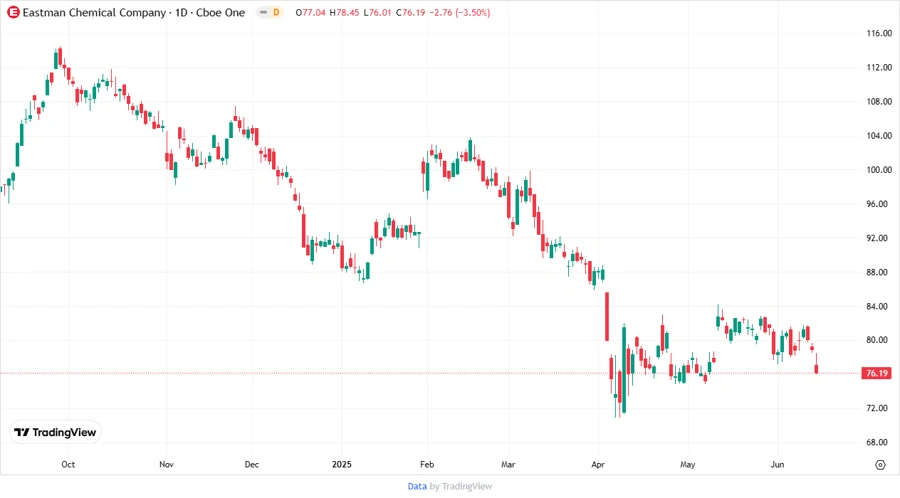
Price Development 📊
Dividend Scoring System ✅
| Criteria | Details | Score |
|---|---|---|
| Dividend Yield | 4.33% | |
| Dividend Stability | 32 Years | |
| Dividend Growth | 5.28% | |
| Payout Ratio | 41.11% | |
| Financial Stability | Stable | |
| Dividend Continuity | Continuous | |
| Cashflow Coverage | Efficient | |
| Balance Sheet Quality | Good |
Total Score: 35/40
Rating ⚠️
Eastman Chemical Company earns a robust score of 35 out of 40 in our Dividend Scoring System. With a solid dividend history, moderate growth, and strong financial stability, it remains an attractive choice for income-focused investors. However, careful attention should be given to its leverage metrics in the coming years.
Smart Data Insight
Master the Perfect Entry & Exit for this Stock
Don't leave your profits to chance. Historically, this stock follows specific seasonal patterns that institutional traders use to maximize returns.
- ✅ Identify the "Golden Buying Window"
- ✅ Avoid high-risk correction cycles
- ✅ Backtested data from the last 20+ years