
July 07, 2026 a 01:15 pm

EME: Trend and Support & Resistance Analysis - EMCOR Group, Inc.
The EMCOR Group, Inc. showcases its expertise through its strong market presence in electrical and mechanical construction services across the US and the UK. This analysis highlights recent stock trends and identifies key support and resistance zones using technical analysis. With comprehensive EMA calculations, the focus is on understanding recent price movements and potential market directions.
Trend Analysis
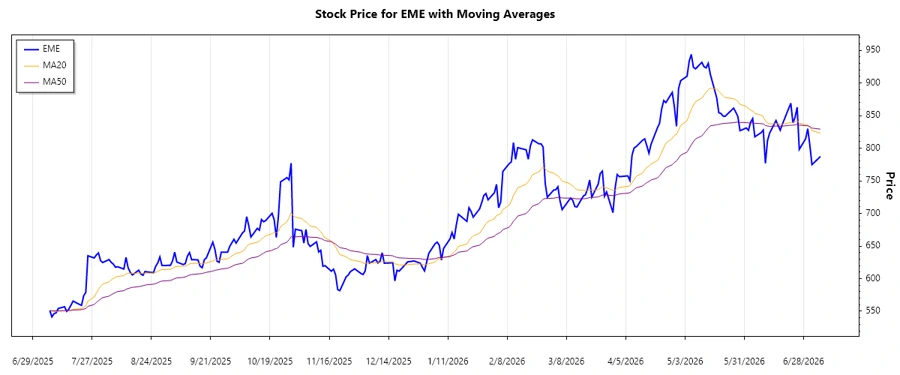
Upon analyzing the stock data, the recent trend indicates a discernible pattern. The EMA20 (Exponential Moving Average over 20 days) and EMA50 (Exponential Moving Average over 50 days) serve as the primary indicators for trend analysis:
| Date | Close Price | Trend |
|---|---|---|
| 2026-07-06 | 787.29 | ▼ |
| 2026-07-02 | 774.66 | ▼ |
| 2026-07-01 | 804.33 | ▲ |
| 2026-06-30 | 829.88 | ▲ |
| 2026-06-29 | 814.41 | ▲ |
| 2026-06-26 | 798.1 | ▼ |
| 2026-06-25 | 862.66 | ▲ |
The current trend suggests a mixed signal with a tendency towards a downward movement, as EMA20 is approaching or falling below EMA50. This indicates a potential bearish phase.
Support and Resistance
The following support and resistance zones have been identified based on recent price movements:
| Zone Type | From | To |
|---|---|---|
| Support | 750 | 770 |
| Support | 700 | 730 |
| Resistance | 830 | 850 |
| Resistance | 870 | 890 |
The current stock price is in the resistance zone of 830 - 850, suggesting a potential reversal if the upward momentum weakens.
Conclusion
The technical analysis of EMCOR Group, Inc. stock reveals mixed signals in the market. While the EMA20 nearing EMA50 indicates cautious sentiment, the stock hovering in resistance zones suggests traders are actively testing upper price boundaries. This confluence may result in either a breakout or retracement phase. Despite recent fluctuations, the company's robust fundamentals could stabilize the stock. Investors should remain vigilant of any breakout signals, ensuring timely responses to emerging opportunities.
Smart Data Insight
Master the Perfect Entry & Exit for this Stock
Don't leave your profits to chance. Historically, this stock follows specific seasonal patterns that institutional traders use to maximize returns.
- ✅ Identify the "Golden Buying Window"
- ✅ Avoid high-risk correction cycles
- ✅ Backtested data from the last 20+ years