
July 26, 2026 a 04:44 pm
EME: Fibonacci Analysis - EMCOR Group, Inc.
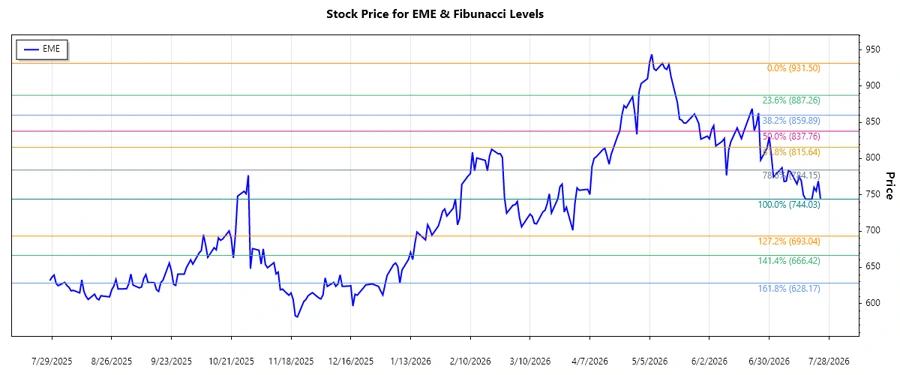
EMCOR Group, Inc., with its diversified services in construction and facilities management, has seen a fluctuating market performance over the last few months. An examination of the stock's historical price data reveals notable trends. This analysis aims to identify recent movements, particularly through Fibonacci retracement levels, offering insights for potential investment strategies.
Fibonacci Analysis
| Criteria | Details |
|---|---|
| Start Date | 2026-05-11 |
| End Date | 2026-07-24 |
| High Price | 931.50 on 2026-05-11 |
| Low Price | 744.03 on 2026-07-20 |
| Fibonacci Levels |
|
| Current Price & Zone | 744.85, below 0.236 Fibonacci level |
| Interpretation | The current price is below the 0.236 Fibonacci level, suggesting potential oversold conditions or a strong downtrend continuation. |
Conclusion
The EMCOR Group, Inc. stock has experienced a significant downturn, with the current price below critical Fibonacci levels. This might indicate persistent selling pressure or market skepticism regarding the company's performance. However, this downtrend could also present attractive entry points for long-term investors seeking value. Analysts should closely monitor any reversal signals or changes in market sentiment. The broader economic environment and sector-specific developments will be crucial in determining future price action.
Smart Data Insight
Master the Perfect Entry & Exit for this Stock
Don't leave your profits to chance. Historically, this stock follows specific seasonal patterns that institutional traders use to maximize returns.
- ✅ Identify the "Golden Buying Window"
- ✅ Avoid high-risk correction cycles
- ✅ Backtested data from the last 20+ years