June 13, 2026 a 03:31 am
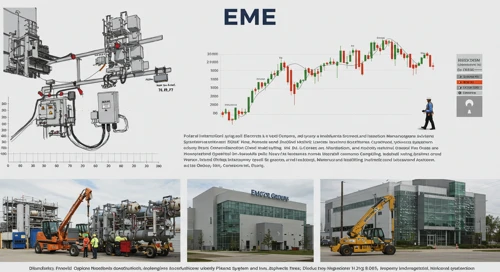


EME: Dividend Analysis - EMCOR Group, Inc.
EMCOR Group, Inc. demonstrates a robust dividend profile characterized by stable growth over recent years. Its dividend history and growth rates indicate a commitment to shareholder returns while maintaining financial flexibility. The firm's low payout ratios suggest ample capacity for future dividend increases, making it an attractive choice for income-seeking investors.
Overview
📊 EMCOR Group, Inc. is an industrial player in the engineering and construction sector. With a consistent dividend yield of 0.16%, the company has been paying a dividend for 16 years without any cuts or suspensions. The current dividend per share stands at $1.00 USD.| Category | Value |
|---|---|
| Sector | Engineering & Construction |
| Dividend yield | 0.16% |
| Current dividend per share | $1.00 USD |
| Dividend history | 16 years |
| Last cut or suspension | None |
Dividend History
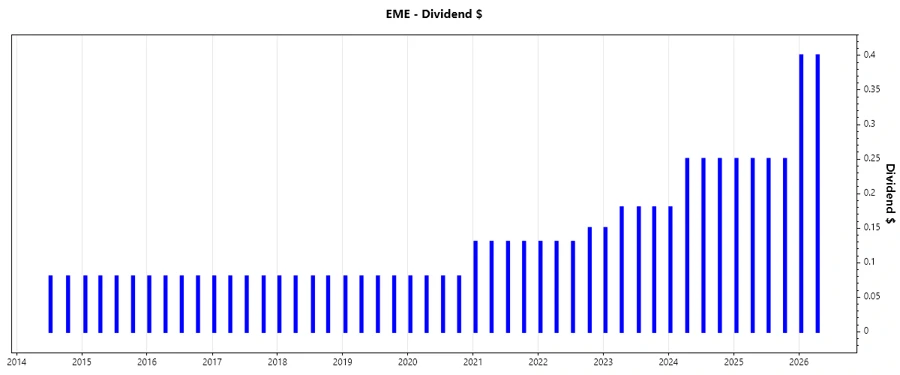
🗣️ EMCOR Group's dividend history reflects its dedication to returning capital to shareholders. A stable and consistent dividend payment record is paramount for dividend investors seeking reliability in cash flows.
| Year | Dividend per Share (USD) |
|---|---|
| 2026 | 0.80 |
| 2025 | 1.00 |
| 2024 | 0.93 |
| 2023 | 0.69 |
| 2022 | 0.54 |
Dividend Growth
📈 The consistent growth in EMCOR's dividends underlines its potential for capital appreciation alongside income generation. Historical growth rates over three and five years suggest the company's resilient earning capacity.| Time | Growth |
|---|---|
| 3 years | 22.80% |
| 5 years | 25.59% |
The average dividend growth is 25.59% over 5 years. This shows moderate but steady dividend growth.
Payout Ratio
✅ EMCOR Group maintains a conservative payout strategy with an EPS-based payout ratio of approximately 3.37% and a free cash flow-based payout of 4.13%. These figures indicate a prudent dividend strategy, providing ample room for reinvestment and growth.| Key figure | Ratio |
|---|---|
| EPS-based | 3.37% |
| Free cash flow-based | 4.13% |
Such low payout ratios reflect a very sustainable dividend policy, allowing for future increases.
Cashflow & Capital Efficiency
📈 EMCOR maintains efficient cash flow management and capital allocation. These metrics underscore the company's operational robustness and ability to generate returns for investors.| Year | 2023 | 2024 | 2025 |
|---|---|---|---|
| Free Cash Flow Yield | 8.05% | 6.30% | 4.32% |
| Earnings Yield | 6.20% | 4.76% | 4.61% |
| CAPEX to Operating Cash Flow | 8.71% | 5.32% | 8.65% |
| Stock-based Compensation to Revenue | 0.11% | 0.14% | 0.03% |
| Free Cash Flow / Operating Cash Flow Ratio | 91.29% | 94.68% | 91.34% |
The company's cash flow ratios indicate solid performance in generating operational cash flow, crucial for sustaining dividends and achieving capital growth.
Balance Sheet & Leverage Analysis
📉 With a low debt-to-equity and favorable coverage ratios, EMCOR exhibits a robust balance sheet supporting financial health and resilience.| Year | 2023 | 2024 | 2025 |
|---|---|---|---|
| Debt-to-Equity | 13.98% | 11.88% | 22.96% |
| Debt-to-Assets | 5.22% | 4.52% | 8.79% |
| Debt-to-Capital | 12.27% | 10.62% | 18.67% |
| Net Debt to EBITDA | -4.40% | -65.40% | -13.49% |
| Current Ratio | 1.26 | 1.30 | 1.22 |
| Quick Ratio | 1.23 | 1.27 | 1.19 |
| Financial Leverage | 2.68 | 2.63 | 2.61 |
The balance sheet metrics suggest a well-capitalized company with manageable leverage levels, enhancing its financial flexibility.
Fundamental Strength & Profitability
✅ EMCOR Group enjoys strong profitability ratios, which are key indicators of its fundamental financial health.| Year | 2023 | 2024 | 2025 |
|---|---|---|---|
| Return on Equity | 25.63% | 34.28% | 34.57% |
| Return on Assets | 9.58% | 13.05% | 13.23% |
| Margins: Net | 5.03% | 6.91% | 7.47% |
| Margins: EBIT | 7.07% | 9.48% | 10.69% |
| Margins: EBITDA | 8.02% | 10.40% | 11.71% |
| Margins: Gross | 16.60% | 18.98% | 19.58% |
| Research & Development to Revenue | 0.00% | 0.00% | 0.00% |
The profitability metrics reflect EMCOR's strong operational efficiency and effective cost management strategies.
Price Development
Dividend Scoring System
🎯 EMCOR's dividend is evaluated across several metrics for a comprehensive assessment of its attractiveness to investors.| Criteria | Score | Score Indicator |
|---|---|---|
| Dividend yield | 3 | |
| Dividend Stability | 5 | |
| Dividend growth | 4 | |
| Payout ratio | 5 | |
| Financial stability | 4 | |
| Dividend continuity | 5 | |
| Cashflow Coverage | 4 | |
| Balance Sheet Quality | 4 |
Total Score: 34/40
Rating
🗣️ Overall, EMCOR Group, Inc. holds a strong position as a dividend payer, supported by its low payout ratios, consistent dividend history, and sound financial management. The company promises stability and growth potential, making it suitable for dividend-focused portfolios with moderate risk appetite.
Smart Data Insight
Master the Perfect Entry & Exit for this Stock
Don't leave your profits to chance. Historically, this stock follows specific seasonal patterns that institutional traders use to maximize returns.
- ✅ Identify the "Golden Buying Window"
- ✅ Avoid high-risk correction cycles
- ✅ Backtested data from the last 20+ years