December 01, 2025 a 07:46 am

EME: Dividend Analysis - EMCOR Group, Inc.
EMCOR Group, Inc. exhibits a stable dividend profile with a consistent history of payments. The company’s current dividend yield is modest, reflecting the broader market trends. However, the solid financial health and growing earnings provide room for potential dividend enhancements. Overall, this stability serves as a testament to its robust financial management.
📊 Overview
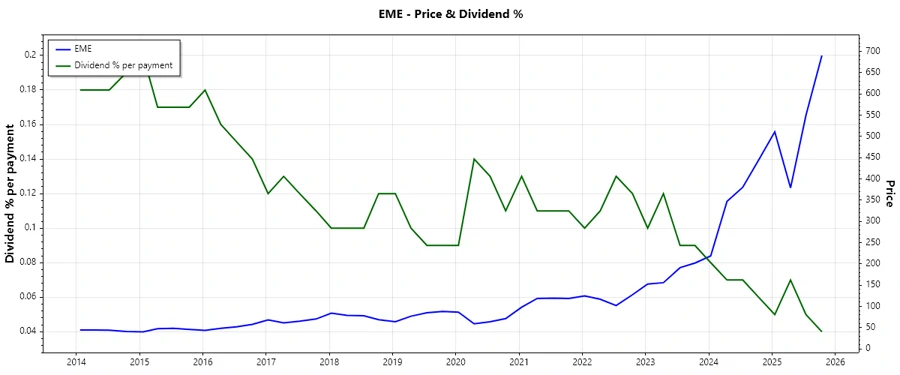
EMCOR Group, Inc. operates within a sector typified by moderate dividend yields, reflecting its emphasis on capital preservation and incremental shareholder returns. The current dividend yield stands at 0.14%, while its dividend history spans 15 uninterrupted years, save for a cut in 2013. This positions EMCOR as a staple income component in investor portfolios, particularly favoring those that appreciate a combination of capital stability and income predictability.
| Data Point | Value |
|---|---|
| Sector | Industrial Services |
| Dividend yield | 0.14 % |
| Current dividend per share | 0.93 USD |
| Dividend history | 15 years |
| Last cut or suspension | 2013 |
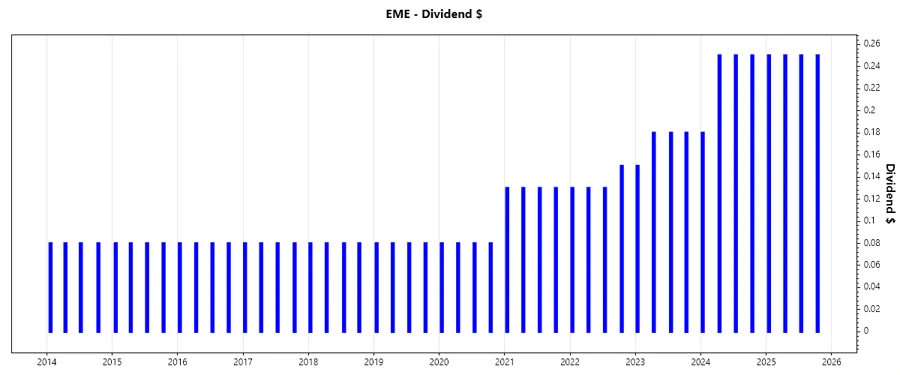
🗣️ Dividend History
The history of dividend payments is crucial as it reflects the company's long-term dedication to returning capital to shareholders. EMCOR Group’s ability to maintain dividends through varied economic cycles signifies its financial resiliency.
| Year | Dividend per Share (USD) |
|---|---|
| 2025 | 1.00 |
| 2024 | 0.93 |
| 2023 | 0.69 |
| 2022 | 0.54 |
| 2021 | 0.52 |
📈 Dividend Growth
Dividend growth is a pivotal factor for sustainable income and long-term investment appeal. EMCOR has demonstrated respectable dividend growth rates over recent years, indicating management's confidence in cash flow growth and operational stability.
| Time | Growth |
|---|---|
| 3 years | 21.38 % |
| 5 years | 23.78 % |
The average dividend growth is 23.78% over 5 years. This shows moderate but steady dividend growth.
📉 Payout Ratio
Payout ratios are critical indicators of the sustainability of dividends. EMCOR’s payout based on EPS and FCF are both underwhelmingly low, registering at 3.69% and 3.63%, respectively, which highlights a conservative approach to dividend payouts that ensures ample room for reinvestment in growth operations.
| Key figure | Ratio |
|---|---|
| EPS-based | 3.69 % |
| Free cash flow-based | 3.63 % |
Such low payout ratios signify strong capacity to maintain and potentially increase dividends even in less favorable economic periods.
✅ Cashflow & Capital Efficiency
Analyzing the cash flow and capital efficiency is indispensable in assessing a company's ability to sustain dividend payments. EMCOR’s consistent free cash flow yield and operational efficiency represent positive attributes that fortify its financial positioning for ongoing dividend disbursals.
| Year | 2024 | 2023 | 2022 |
|---|---|---|---|
| Free Cash Flow Yield | 6.30 % | 8.05 % | 6.07 % |
| Earnings Yield | 4.76 % | 6.20 % | 5.49 % |
| CAPEX to Operating Cash Flow | 5.32 % | 8.71 % | 9.90 % |
| Stock-based Compensation to Revenue | 0.14 % | 0.11 % | 0.11 % |
| Free Cash Flow / Operating Cash Flow Ratio | 94.68 % | 91.29 % | 90.10 % |
These figures communicate resiliency in cash flow streams critical for capital projects and fortify EMCOR's potential for dividend adaptability.
⚠️ Balance Sheet & Leverage Analysis
Balance sheet analysis, focusing on leverage ratios like debt-to-equity, offers insights into financial robustness. EMCOR possesses favorable leverage ratios, showcasing prudent debt management. Positive liquidity metrics suggest a commendable capacity to meet both short and long-term obligations.
| Year | 2024 | 2023 | 2022 |
|---|---|---|---|
| Debt-to-Equity | 11.88 % | 13.98 % | 27.12 % |
| Debt-to-Assets | 4.52 % | 5.22 % | 9.69 % |
| Debt-to-Capital | 10.62 % | 12.27 % | 21.33 % |
| Net Debt to EBITDA | -0.65 | -0.44 | 0.12 |
| Current Ratio | 1.30 | 1.26 | 1.26 |
| Quick Ratio | 1.27 | 1.23 | 1.23 |
| Financial Leverage | 2.63 | 2.68 | 2.80 |
The analysis underscores an investment-grade balance sheet with sound leverage and liquidity metrics, which are reassuring for maintaining the trajectory of dividend stability.
✅ Fundamental Strength & Profitability
Evaluating fundamental strengths through profitability ratios like return on equity and asset returns reveals insights into the firm’s efficiency and profitability landscape. EMCOR’s consistent profitability metrics underscore operational excellence.
| Year | 2024 | 2023 | 2022 |
|---|---|---|---|
| Return on Equity | 34.28 % | 25.63 % | 20.58 % |
| Return on Assets | 13.05 % | 9.58 % | 7.35 % |
| Margins: Net | 6.91 % | 5.03 % | 3.67 % |
| Margins: EBIT | 9.48 % | 7.07 % | 5.16 % |
| Margins: EBITDA | 10.40 % | 8.02 % | 6.14 % |
| Margins: Gross | 18.98 % | 16.60 % | 14.48 % |
| Research & Development to Revenue | 0 % | 0 % | 0 % |
These profitability indicators reflect a robust business model capable of generating substantial returns while maintaining growth, underpinning the rationale for continued dividend payouts.
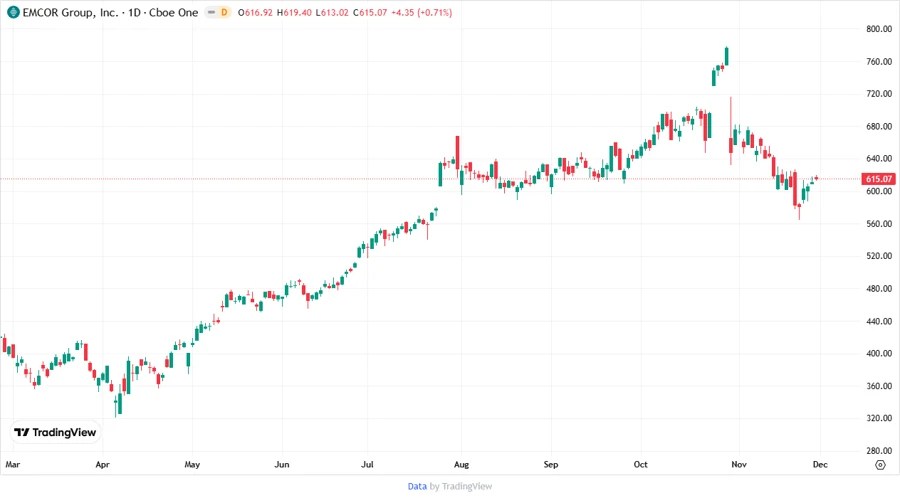
📉 Price Development
🗣️ Dividend Scoring System
| Criteria | Score | Score Bar |
|---|---|---|
| Dividend yield | 2 | |
| Dividend Stability | 4 | |
| Dividend growth | 4 | |
| Payout ratio | 5 | |
| Financial stability | 5 | |
| Dividend continuity | 4 | |
| Cashflow Coverage | 5 | |
| Balance Sheet Quality | 4 |
Total Score: 33 out of 40
✅ Rating
EMCOR Group, Inc. offers a compelling case for income-oriented investors with its robust dividend track record, solid financial fundamentals, and ample growth opportunities. The analysis suggests a promising prospect for continued dividend reliability, backed by sound financial discipline and stable cash flows. This stock is rated as a "hold," favoring current owners with steady income but potential new investors should weigh the balance between modest yields and excellent financial health.