November 05, 2025 a 06:44 am

EL: Fibonacci Analysis - The Estée Lauder Companies Inc.
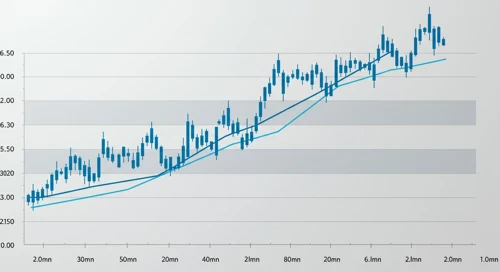
The Estée Lauder Companies Inc. has experienced significant trends in the past months, reflective of broader market conditions and company-specific developments. Investors should pay close attention to this stock as it may offer potential opportunities for capitalizing on market movements. Technical patterns suggest key levels of interest that could lead to strategic decisions for market participants.
Fibonacci Analysis
| Metric | Details |
|---|---|
| Trend Start Date | 2025-04-07 |
| Trend End Date | 2025-10-20 |
| High Price | $102.52 on 2025-10-20 |
| Low Price | $50.06 on 2025-04-08 |
| Current Price | $92.88 |
Fibonacci Levels
| Level | Price |
|---|---|
| 0.236 | $69.98 |
| 0.382 | $77.40 |
| 0.500 | $81.29 |
| 0.618 | $85.19 |
| 0.786 | $91.35 |
Observations indicate that the current price is within the 0.786 retracement level at $91.35, suggesting potential resistance at this level. This positioning hints at a technical pullback or consolidation, which could present a buying or selling opportunity.
Conclusion
In summary, The Estée Lauder Companies Inc.’s stock has shown robust upward movement from April to October 2025. The current market pattern is reflective of historical technical retracement levels, with opportunities arising at specific Fibonacci zones. While this suggests potential resistance around $91.35, there remains an equal possibility of overcoming this barrier with sufficient momentum. Risks primarily revolve around broader economic influences and shifts in consumer sentiment, but strategic positioning based on current trends may offer rewarding returns. Analysts ought to remain vigilant, observing market entries as the stock navigates these critical technical thresholds.
Smart Data Insight
Master the Perfect Entry & Exit for this Stock
Don't leave your profits to chance. Historically, this stock follows specific seasonal patterns that institutional traders use to maximize returns.
- ✅ Identify the "Golden Buying Window"
- ✅ Avoid high-risk correction cycles
- ✅ Backtested data from the last 20+ years