October 14, 2025 a 11:45 am

EL: Fibonacci Analysis - The Estée Lauder Companies Inc.
The Estée Lauder Companies Inc. has shown resilience in a volatile market, with a recent bullish uptrend evident in the stock's performance. The company's strategic diversification across beauty and fragrance products, both luxury and mid-range, paired with its extensive global reach, positions it as a formidable player in its industry. As we conduct a Fibonacci analysis on its stock, it's crucial to consider the influence of external economic factors, including consumer spending trends and currency fluctuations, which could impact future performance.
Fibonacci Analysis
| Attribute | Details |
|---|---|
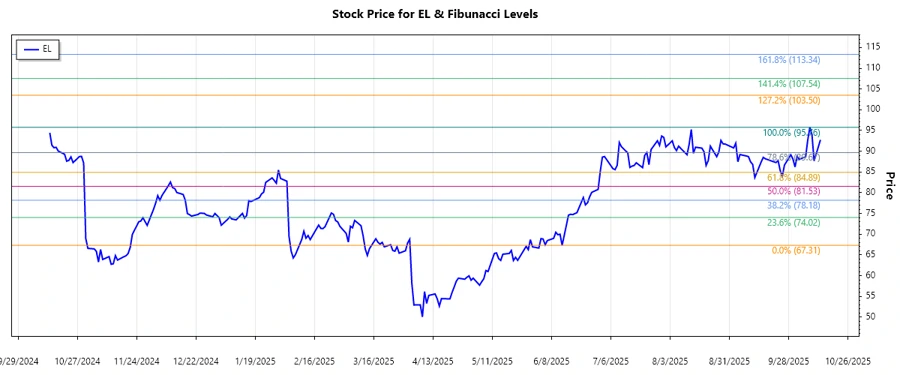
| Start Date of Trend | 2025-06-13 |
| End Date of Trend | 2025-10-08 |
| High Price (Date) | 95.76 (2025-10-08) |
| Low Price (Date) | 67.31 (2025-06-13) |
| Fibonacci Levels |
|
| Current Price | $92.74 |
| Retracement Zone | 0.618 (Support Level) |
Conclusion
Estée Lauder's recent uptrend indicates strong market confidence, supported by robust earnings and strategic positioning. The current price sitting within the 0.618 Fibonacci retracement level suggests a potent support zone, potentially ushering in further bullish momentum. However, analysts should be cautious of macroeconomic risks, including exchange rate impacts and changes in consumer sentiment, which may pose threats. Despite these risks, the stock is well-positioned for growth, contingent on market conditions and internal strategic maneuvers. Balanced attention to its international market share growth could fortify its competitive stance.