September 05, 2025 a 04:44 pm

EL: Fibonacci Analysis - The Estée Lauder Companies Inc.
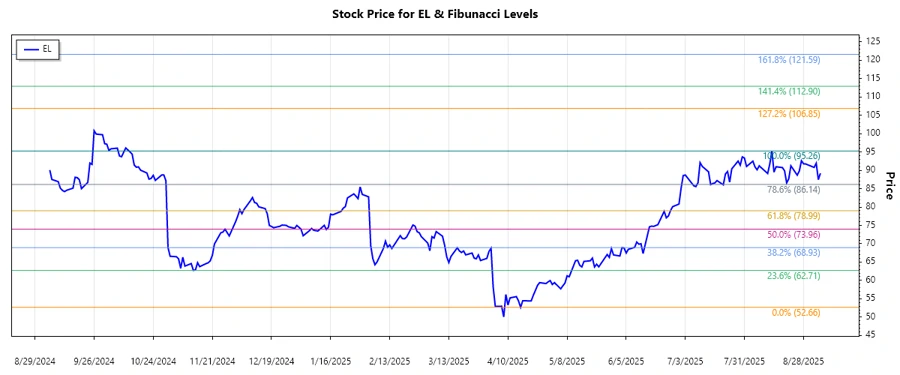
The Estée Lauder Companies Inc. (EL) has shown a notable price increase over the past months, demonstrating a dominant uptrend. As a global leader in the beauty industry, the company's stock movement reflects its robust expansion strategies and strong brand portfolio. This technical analysis reviews the recent price action to determine potential support and resistance levels.
Fibonacci Analysis
| Start Date | End Date | High Price | High Date | Low Price | Low Date |
|---|---|---|---|---|---|
| 2024-12-16 | 2025-08-13 | 95.26 | 2025-08-13 | 52.66 | 2024-12-16 |
| Fibonacci Level | Price Level |
|---|---|
| 0.236 | 63.05 |
| 0.382 | 70.1 |
| 0.5 | 73.96 |
| 0.618 | 77.82 |
| 0.786 | 84.51 |
Current price is at 89.20, within the retracement zone of 0.786.
This indicates potential resistance around the current levels, as the stock approaches the upper boundary of the Fibonacci retracement.
Conclusion
The Estée Lauder Companies Inc. has demonstrated resilience and growth with a notable uptrend. While the current price suggests potential resistance at the upper Fibonacci level, a break above could signify further bullish momentum. Analysts should consider the company's strong brand portfolio and market expansion tactics as key factors for continued growth. However, external market conditions and competition in the beauty industry remain potential risks to monitor. Overall, the technical outlook is cautiously optimistic given the current retracement.
Smart Data Insight
Master the Perfect Entry & Exit for this Stock
Don't leave your profits to chance. Historically, this stock follows specific seasonal patterns that institutional traders use to maximize returns.
- ✅ Identify the "Golden Buying Window"
- ✅ Avoid high-risk correction cycles
- ✅ Backtested data from the last 20+ years