
August 16, 2025 a 06:45 am
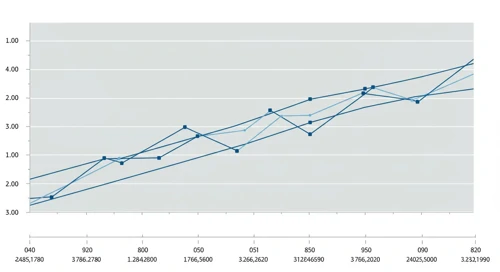

EL: Fibonacci Analysis - The Estée Lauder Companies Inc.
The Estée Lauder Companies Inc., a market leader in luxury beauty products, has seen its stock undergo significant fluctuations over recent months. The company's diversified portfolio, comprising skincare, makeup, and fragrances, is widely recognized. Despite global economic uncertainties, Estée Lauder's innovative strategies and brand reputation continue to foster investor interest. The following analysis employs Fibonacci retracement levels to provide insights into potential support and resistance areas for the stock.
Fibonacci Analysis
| Trend Start Date | Trend End Date | High Price (Date) | Low Price (Date) |
|---|---|---|---|
| 2025-06-13 | 2025-08-13 | $95.26 (2025-08-13) | $67.31 (2025-06-13) |
| Fibonacci Level | Price |
|---|---|
| 0.236 | $75.92 |
| 0.382 | $80.62 |
| 0.5 | $84.29 |
| 0.618 | $87.97 |
| 0.786 | $93.02 |
Currently, the stock is near the 0.5 Fibonacci retracement level, suggesting potential support around this area. A sustained hold above this level might signal a reversal or continuation of the upward trend.
Conclusion
The Estée Lauder Companies Inc. remains a pivotal player in the beauty industry with compelling growth prospects. However, external factors such as shifts in consumer spending and foreign exchange impacts pose potential risks. Technically, the stock's behavior around the key Fibonacci levels might provide clues for future price movements. Maintaining a price above the 0.5 retracement level could point to bullish sentiment, while a decline below could imply further downside risks. Analysts should consider both macroeconomic conditions and company-specific initiatives when forecasting the stock’s trajectory.
Smart Data Insight
Master the Perfect Entry & Exit for this Stock
Don't leave your profits to chance. Historically, this stock follows specific seasonal patterns that institutional traders use to maximize returns.
- ✅ Identify the "Golden Buying Window"
- ✅ Avoid high-risk correction cycles
- ✅ Backtested data from the last 20+ years