July 30, 2025 a 07:46 am


EL: Dividend Analysis - The Estée Lauder Companies Inc.
The Estée Lauder Companies Inc. stands out as a significant player in the personal care industry, boasting a rich dividend history that reflects its established market presence. The company offers a moderate dividend yield and an extensive track record of dividend payments spanning three decades. Investors may find its stability appealing; however, recent fluctuations in financial ratios could signal areas of concern. Analyzing its holistic financial health is essential before drawing long-term investment conclusions.
📊 Overview
Estée Lauder operates in the personal care sector, offering a dividend yield of 2.55%. The current dividend per share stands at $2.64 USD, with a solid dividend payment history of 30 years. The last cut or suspension in their dividend policy was reported as none, indicating a strong continuity in shareholder returns.
| Metric | Details |
|---|---|
| Sector | Personal Care |
| Dividend Yield | 2.55% |
| Current Dividend per Share | $2.64 USD |
| Dividend History | 30 years |
| Last Cut or Suspension | None |
🗣️ Dividend History
The company's long track of sustained dividend payouts highlights its dedication to returning capital to shareholders. With a consistent history of 30 years, this underscores a reliable and shareholder-friendly approach, crucial for those seeking regular income streams.
| Year | Dividend per Share (USD) |
|---|---|
| 2025 | 0.70 |
| 2024 | 2.33 |
| 2023 | 2.64 |
| 2022 | 2.46 |
| 2021 | 2.19 |
📈 Dividend Growth
The trajectory of dividend growth serves as a critical indicator of a company's long-term commitment to enhancing shareholder value. Estée Lauder's dividends have grown modestly over the past few years, which reflects a cautious yet positive stride forward.
| Time | Growth |
|---|---|
| 3 years | 2.09% |
| 5 years | 5.65% |
The average dividend growth is 5.65% over 5 years. This shows moderate but steady dividend growth.
✅ Payout Ratio
Payout ratios are essential in evaluating the sustainability of dividend payments. They provide insights into whether a company can maintain or grow its current dividend levels from its earnings or free cash flow.
| Ratio Type | Ratio |
|---|---|
| EPS-based | -109.12% |
| Free Cash Flow-based | 100.10% |
The company's EPS-based payout ratio suggests payouts exceed earnings, potentially signaling sustainability concerns. Nevertheless, with a free cash flow payout ratio near parity, Estée Lauder demonstrates an adequate capacity to sustain dividends from its free cash flow.
💰 Cashflow & Capital Efficiency
Understanding cash flows and capital efficiency offers insights into a company's operational health and its ability to allocate capital wisely.
| Metric | 2024 | 2023 | 2022 |
|---|---|---|---|
| Free Cash Flow Yield | 3.81% | -2.22% | 2.18% |
| Earnings Yield | 1.03% | 1.43% | 2.61% |
| CAPEX to Operating Cash Flow | 39.23% | 93.01% | 34.21% |
| Stock-based Compensation to Revenue | 2.08% | 1.68% | 1.87% |
| Free Cash Flow / Operating Cash Flow Ratio | 0.61 | -0.90 | 0.66 |
The fluctuating free cash flow yield and negative earnings yield in recent years highlight volatility, indicating potential challenges in operational cash generation efficiency.
🔍 Balance Sheet & Leverage Analysis
A thorough analysis of the balance sheet and leverage ratios offers a window into a company's financial stability and debt sustainability.
| Metric | 2024 | 2023 | 2022 |
|---|---|---|---|
| Debt-to-Equity | 1.85 | 1.82 | 1.37 |
| Debt-to-Assets | 0.45 | 0.43 | 0.37 |
| Debt-to-Capital | 0.65 | 0.65 | 0.58 |
| Net Debt to EBITDA | 3.25 | 2.61 | 0.97 |
| Current Ratio | 1.39 | 1.46 | 1.60 |
| Quick Ratio | 1.01 | 0.99 | 1.10 |
| Financial Leverage | 4.08 | 4.19 | 3.74 |
The balance sheet demonstrates a relatively high debt-to-equity ratio, but manageable current and quick ratios, suggesting some potential restrictions in liquidity with a sizeable leverage.
📉 Fundamental Strength & Profitability
Profitability indicators like return on equity and asset returns are key to assessing the company's efficiency and profitability.
| Metric | 2024 | 2023 | 2022 |
|---|---|---|---|
| Return on Equity | 7.34% | 18.01% | 42.75% |
| Return on Assets | 1.80% | 4.30% | 11.43% |
| Margins: Net | 2.50% | 6.32% | 13.47% |
| EBIT | 7.37% | 10.16% | 17.32% |
| EBITDA | 12.69% | 14.77% | 21.35% |
| Gross | 71.66% | 71.31% | 75.73% |
| R&D to Revenue | 2.31% | 2.16% | 1.73% |
While margins and asset returns reveal strong past profitability, the decline in return on equity necessitates cautious optimism concerning future prospects.
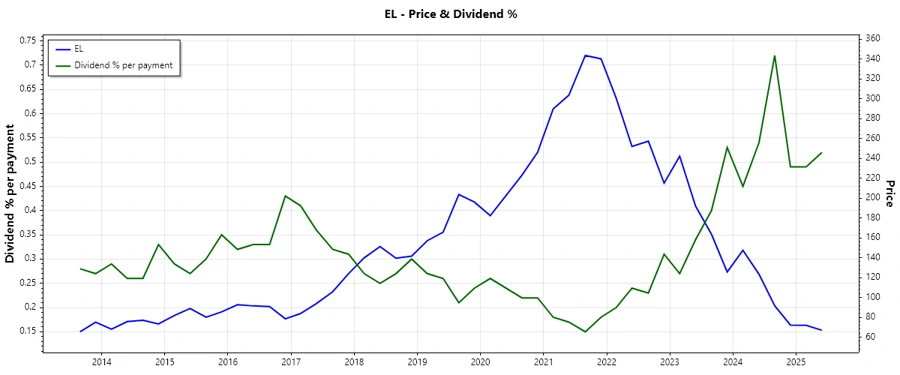
🔔 Price Development
Dividend Scoring System
| Criteria | Score (Out of 5) | Score Bar |
|---|---|---|
| Dividend Yield | 3 | |
| Dividend Stability | 5 | |
| Dividend Growth | 3 | |
| Payout Ratio | 2 | |
| Financial Stability | 3 | |
| Dividend Continuity | 5 | |
| Cashflow Coverage | 2 | |
| Balance Sheet Quality | 3 |
Total Score: 26/40
🏆 Rating:
With a substantial dividend history and a commitment to ongoing shareholder returns, The Estée Lauder Companies Inc. earns a favorable standing for long-term income investors. Nonetheless, attention to recent financial volatility and payout inconsistencies is advised for cautious investment planning. The firm's investment stands marked as 'Moderate Risk' with positive income prospects, requiring vigilance regarding financial health trajectory.
Smart Data Insight
Master the Perfect Entry & Exit for this Stock
Don't leave your profits to chance. Historically, this stock follows specific seasonal patterns that institutional traders use to maximize returns.
- ✅ Identify the "Golden Buying Window"
- ✅ Avoid high-risk correction cycles
- ✅ Backtested data from the last 20+ years