October 03, 2025 a 06:45 am
ELV: Fibonacci Analysis - Elevance Health Inc.
The Elevance Health Inc. (ELV) stock has shown a dynamic price movement over the past few months. As a significant player in the health benefits sector, the company is in a unique position to capitalize on the increasing demand for comprehensive care solutions. With a vast portfolio supporting over 100 million customers, the performance of its stock can be influenced by broader sector trends and specific company developments. Recent price trends indicate potential opportunities for investors and traders who are paying close attention to technical indicators such as Fibonacci retracements.
Fibonacci Analysis
| Aspect | Details |
|---|---|
| Start Date of Trend | 2025-07-01 |
| End Date of Trend | 2025-10-02 |
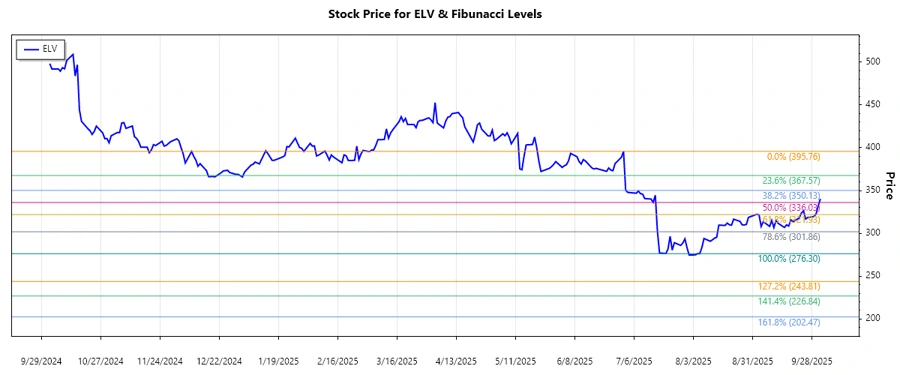
| High Point (Price/Date) | $395.76 / 2025-07-01 |
| Low Point (Price/Date) | $276.3 / 2025-08-06 |
| Current Price | $340.24 |
| 0.236 Level | $305.07 |
| 0.382 Level | $326.71 |
| 0.5 Level | $336.03 |
| 0.618 Level | $345.35 |
| 0.786 Level | $360.36 |
| Retracement Zone | 0.5 |
| Technical Interpretation | The stock is currently near the 0.5 Fibonacci retracement level, suggesting it might be at a technical support point, which could potentially lead to a reversal. |
Conclusion
The ELV stock's recent price action reveals a recovery trend after hitting a low point. The current positioning near the 0.5 retracement level indicates potential strength, offering investors a possible entry point if the stock finds support at this level. However, any sustained deviation or weak technical signals could lead to further declines, necessitating cautious strategies. Analysts should contemplate both external healthcare sector drivers and company-specific news, especially as market sentiment can swiftly shift. It's crucial to monitor emerging patterns that could either solidify the current uptrend or suggest further retracement adjustments.