May 07, 2026 a 03:31 pm

ELV: Dividend Analysis - Elevance Health Inc.
Elevance Health Inc. presents a modest dividend yield, yet it shows a history of consistent dividends over 16 years with no recent cuts or suspensions. Despite a conservative payout ratio, the company's financial stability and steady dividend growth depict a promising long-term investment opportunity.
📊 Overview
Elevance Health Inc. is a prominent player in its sector, offering:
| Sector | Dividend Yield | Current Dividend per Share | Dividend History | Last Cut/Suspension |
|---|---|---|---|---|
| Health | 1.83% | 6.89 USD | 16 years | None |
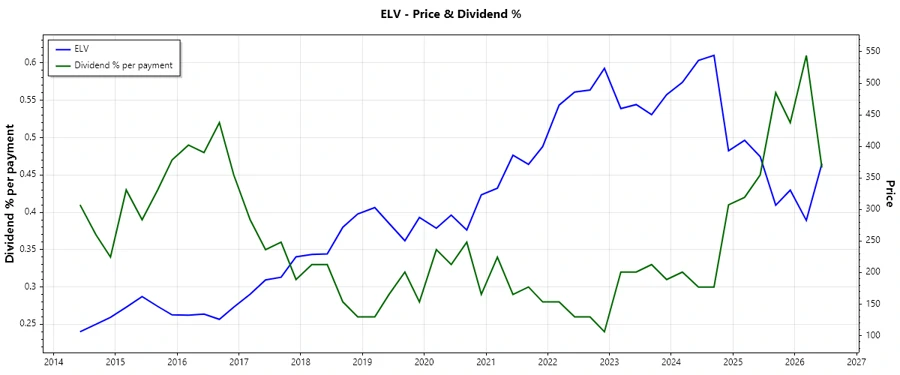
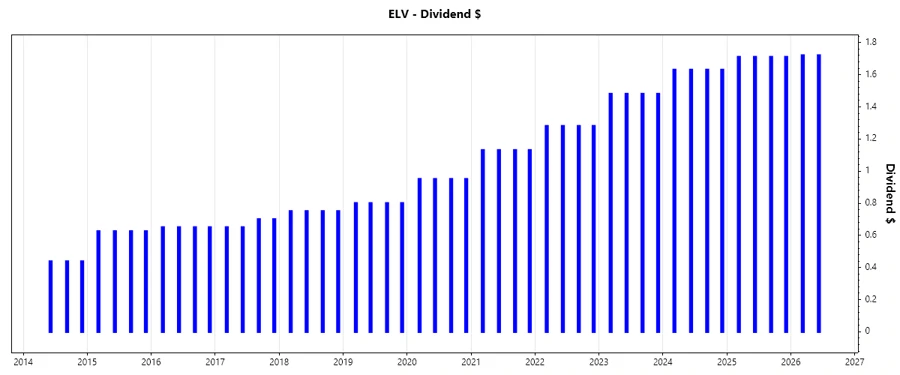
🗣️ Dividend History
Tracking historical dividend payments is essential to assess a firm's commitment to returning value to shareholders. Elevance Health has persistently paid dividends without reduction.
| Year | Dividend per Share (USD) |
|---|---|
| 2026 | 3.44 |
| 2025 | 6.84 |
| 2024 | 6.52 |
| 2023 | 5.92 |
| 2022 | 5.12 |
📈 Dividend Growth
The growth of dividends over time demonstrates a company's potential for increasing shareholder value. Elevance Health's dividends have grown steadily over the last few years.
| Time | Growth |
|---|---|
| 3 years | 10.14% |
| 5 years | 12.47% |
The average dividend growth is 12.47% over 5 years. This shows moderate but steady dividend growth.
📉 Payout Ratio
The payout ratio is an indicator of sustainable dividend distributions. Elevance Health maintains a cautious payout ratio which indicates prudent financial management.
| Key Figure | Ratio |
|---|---|
| EPS-based | 28.99% |
| Free cash flow-based | 23.21% |
The payout ratios suggest that the dividends are sustainable, with 28.99% of earnings and 23.21% of free cash flow allocated to dividends.
💰 Cashflow & Capital Efficiency
Assessing cash flow and capital efficiency is critical to evaluating a company's operational health.
| Measure | 2023 | 2024 | 2025 |
|---|---|---|---|
| Free Cash Flow Yield | 6.16% | 5.30% | 4.08% |
| Earnings Yield | 5.47% | 6.96% | 7.28% |
| CAPEX to Operating Cash Flow | 16.08% | 21.63% | 26.01% |
| Stock-based Compensation to Revenue | 0.17% | 0.11% | 0.14% |
| Free Cash Flow / Operating Cash Flow Ratio | 83.92% | 78.37% | 73.99% |
Overall, the company demonstrates solid cash flow stability with efficient capital allocation, while maintaining shareholder returns.
🛡️ Balance Sheet & Leverage Analysis
Analyzing the balance sheet helps determine financial stability and risk exposure.
| Measure | 2023 | 2024 | 2025 |
|---|---|---|---|
| Debt-to-Equity | 0.68 | 0.79 | 0.76 |
| Debt-to-Assets | 0.24 | 0.28 | 0.27 |
| Debt-to-Capital | 0.40 | 0.44 | 0.43 |
| Net Debt to EBITDA | 1.92 | 2.33 | 2.46 |
| Current Ratio | 0.97 | 1.10 | 1.24 |
| Quick Ratio | 0.97 | 1.10 | 1.24 |
| Financial Leverage | 2.77 | 2.83 | 2.77 |
Elevance Health Inc. exhibits a stable leverage profile with manageable debt levels, indicating financial resilience and low liquidity risk.
✅ Fundamental Strength & Profitability
These metrics offer insight into a company's operational efficiency and profit-generating capability.
| Measure | 2023 | 2024 | 2025 |
|---|---|---|---|
| Return on Equity (ROE) | 15.23% | 14.47% | 12.90% |
| Return on Assets (ROA) | 5.50% | 5.12% | 4.66% |
| Net Margin | 3.49% | 3.38% | 2.84% |
| Gross Margin | 27.44% | 27.85% | 25.56% |
| Research & Development to Revenue | 0.00% | 0.00% | 0.00% |
The company maintains strong profitability margins with robust ROE and ROA. Its margin performance indicates operational efficiency and competitive advantage.
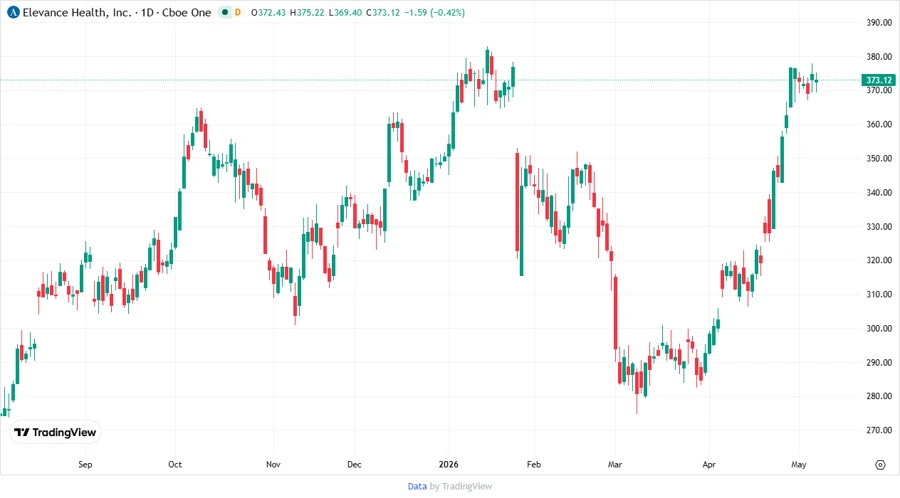
💹 Price Development
Dividend Scoring System
| Criteria | Score | Score Bar |
|---|---|---|
| Dividend Yield | 3 | |
| Dividend Stability | 5 | |
| Dividend Growth | 4 | |
| Payout Ratio | 4 | |
| Financial Stability | 4 | |
| Dividend Continuity | 5 | |
| Cashflow Coverage | 4 | |
| Balance Sheet Quality | 4 |
Total Score: 33/40
🌟 Rating
Elevance Health Inc. is a strong dividend candidate with a reliable history, stable financials, and moderate growth prospects. The company is a sound investment for those seeking steady income and stable growth. Recommended for investors looking for long-term, moderate risk exposure.
Smart Data Insight
Master the Perfect Entry & Exit for this Stock
Don't leave your profits to chance. Historically, this stock follows specific seasonal patterns that institutional traders use to maximize returns.
- ✅ Identify the "Golden Buying Window"
- ✅ Avoid high-risk correction cycles
- ✅ Backtested data from the last 20+ years