May 04, 2026 a 12:46 pm

ELV: Dividend Analysis - Elevance Health Inc.
Elevance Health Inc. represents a compelling opportunity for dividend-oriented investors, boasting a competitive yield of 1.84% along with a history of consistent dividend payments over the last 16 years. The company's prudent payout ratios and stable financial position suggest a diligent management approach that appears committed to sustainability in its dividend policy.
📊 Overview
Elevance Health Inc. operates within the critical healthcare sector, bolstered by a reliable track record of maintaining and growing dividends over time. Currently, the stock delivers a dividend yield of 1.84%, supporting investors seeking income generation. Furthermore, the impressive 16-year history of dividends and the absence of any cuts or suspensions enhance its stature as a stable dividend payer.
| Detail | Value |
|---|---|
| Sector | Healthcare |
| Dividend Yield | 1.84% |
| Current Dividend per Share | 6.89 USD |
| Dividend History | 16 years |
| Last Cut or Suspension | None |
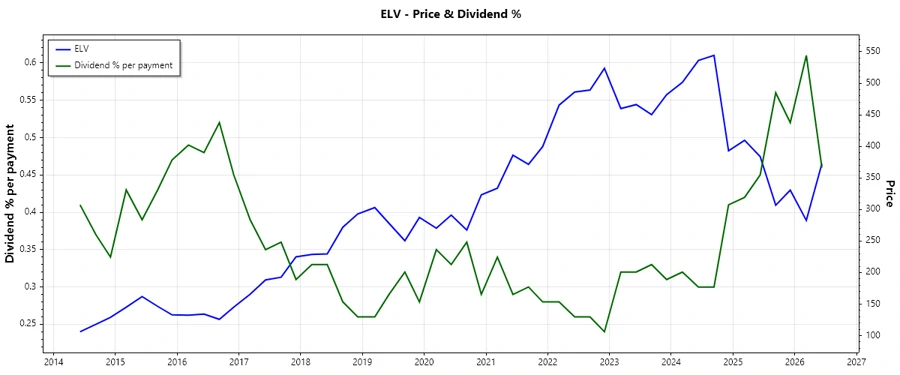
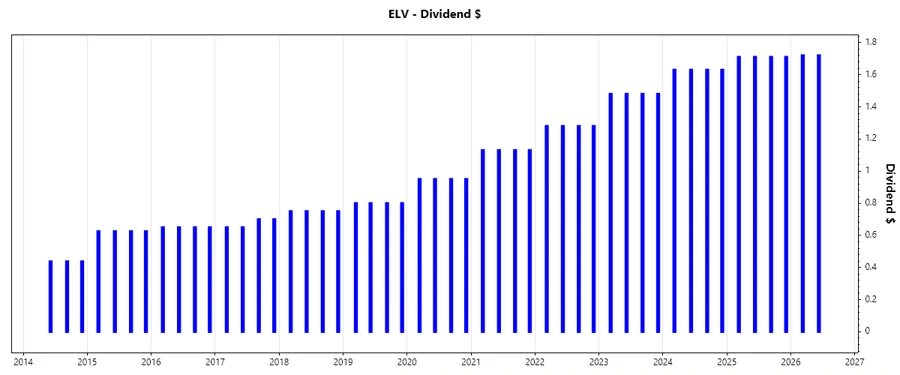
📉 Dividend History
The strong dividend history of Elevance Health Inc. demonstrates its commitment to returning capital to shareholders. This history is a testament to the company's resilience and adaptability in the consistently evolving healthcare landscape. A stable dividend history is paramount for those valuing regular income from their investments.
| Year | Dividend per Share (USD) |
|---|---|
| 2026 | 3.44 |
| 2025 | 6.84 |
| 2024 | 6.52 |
| 2023 | 5.92 |
| 2022 | 5.12 |
📈 Dividend Growth
The examination of Elevance's dividend growth underscores its financial strength and the robust nature of its business model. Stability and a moderate growth trajectory in dividends signal strong profitability and cash flow management.
| Time | Growth |
|---|---|
| 3 years | 10.14% |
| 5 years | 12.47% |
The average dividend growth is 12.47% over 5 years. This shows moderate but steady dividend growth.
✅ Payout Ratio
The payout ratios are pivotal in understanding the sustainability of dividend payments. A lower EPS-based payout ratio of 28.99% and a FCF-based ratio of 23.21% suggest that Elevance Health has ample room to maintain or even increase dividends without negatively impacting its financial health.
| Key figure | Ratio |
|---|---|
| EPS-based | 28.99% |
| Free cash flow-based | 23.21% |
🗣️ Cashflow & Capital Efficiency
Understanding cashflow and capital efficiency metrics is crucial to gauge a company’s ability to sustain and grow its dividend payouts. The metrics suggest Elevance Health is maintaining healthy cash flow margins and capital efficiency ratios.
| Metric | 2025 | 2024 | 2023 |
|---|---|---|---|
| Free Cash Flow Yield | 4.08% | 5.30% | 6.16% |
| Earnings Yield | 7.28% | 6.96% | 5.45% |
| CAPEX to Operating Cash Flow | 26.01% | 21.63% | 16.08% |
| Stock-based Compensation to Revenue | 0.14% | 0.11% | 0.17% |
| Free Cash Flow / Operating Cash Flow Ratio | 73.99% | 78.37% | 83.92% |
📊 Balance Sheet & Leverage Analysis
A comprehensive balance sheet analysis sheds light on the financial stability of Elevance Health. The capital structure appears balanced with sustainable debt levels, keeping the leverage metrics within appropriate bounds that suggest fiscal prudence.
| Metric | 2025 | 2024 | 2023 |
|---|---|---|---|
| Debt-to-Equity | 0.76 | 0.79 | 0.68 |
| Debt-to-Assets | 0.27 | 0.28 | 0.24 |
| Debt-to-Capital | 0.43 | 0.44 | 0.40 |
| Net Debt to EBITDA | 2.46 | 2.33 | 1.92 |
| Current Ratio | 1.24 | 1.10 | 0.97 |
| Quick Ratio | 1.24 | 1.10 | 0.97 |
| Financial Leverage | 2.77 | 2.83 | 2.77 |
📈 Fundamental Strength & Profitability
Evaluating profitability and fundamental strength metrics gives insight into how efficiently Elevance Health converts investments into profit. The company displays solid return ratios alongside robust profitability margins, reflecting operational efficiency and strong governance.
| Metric | 2025 | 2024 | 2023 |
|---|---|---|---|
| Return on Equity | 12.90% | 14.47% | 15.23% |
| Return on Assets | 4.66% | 5.12% | 5.50% |
| Net Margin | 2.84% | 3.38% | 3.49% |
| EBIT Margin | 4.07% | 5.14% | 5.10% |
| EBITDA Margin | 4.85% | 5.93% | 6.12% |
| Gross Margin | 25.56% | 27.85% | 27.44% |
| Research & Development to Revenue | 0% | 0% | 0% |
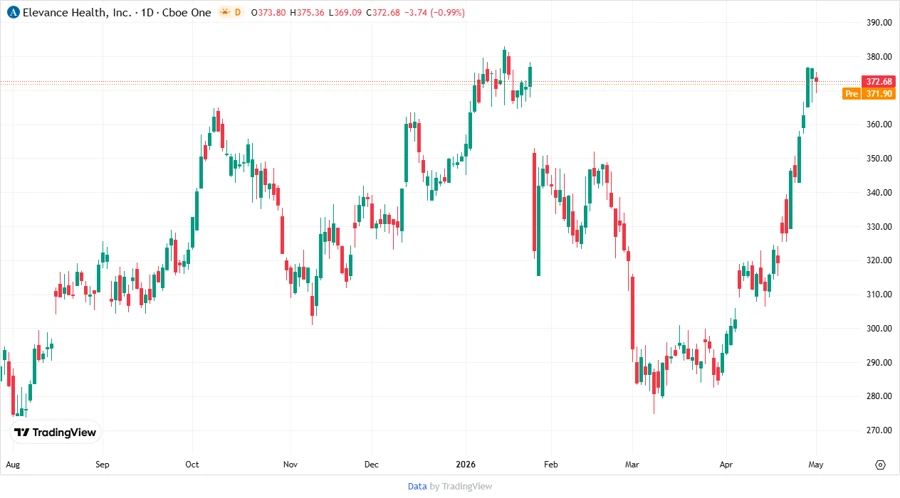
📈 Price Development
🔍 Dividend Scoring System
| Criteria | Score | |
|---|---|---|
| Dividend yield | 4 | |
| Dividend Stability | 5 | |
| Dividend growth | 3 | |
| Payout ratio | 5 | |
| Financial stability | 4 | |
| Dividend continuity | 5 | |
| Cashflow Coverage | 4 | |
| Balance Sheet Quality | 4 |
Total Score: 34 out of 40
🌟 Rating
In conclusion, Elevance Health Inc. stands as a robust choice for dividend-seeking investors, characterized by steady payouts and prudent management. With a strong financial foundation and consistent performance, the company is well-equipped to provide reliable returns to its shareholders.
Smart Data Insight
Master the Perfect Entry & Exit for this Stock
Don't leave your profits to chance. Historically, this stock follows specific seasonal patterns that institutional traders use to maximize returns.
- ✅ Identify the "Golden Buying Window"
- ✅ Avoid high-risk correction cycles
- ✅ Backtested data from the last 20+ years