April 20, 2026 a 11:31 am


📊 ELV: Dividend Analysis - Elevance Health Inc.
Elevance Health Inc., a key player in its sector, showcases a robust dividend profile backed by consistent history and growth, indicating a commitment to shareholder returns. Despite a moderate yield, the company highlights favorable payout ratios and solid financial metrics. This positions it as a reliable choice for dividend-focused investors.
Overview
| Metric | Detail |
|---|---|
| Sector | Health |
| Dividend Yield | 1.21 % |
| Current Dividend per Share | 6.89 USD |
| Dividend History | 16 years |
| Last Cut or Suspension | None |
📈 Dividend History
The longevity of Elevance's dividend history underscores its stable commitment to sharing profits with shareholders. This reliability is especially crucial for income-focused investors. Historically, consistent dividend payments reflect company stability and robust financial management.
| Year | Dividend per Share (USD) |
|---|---|
| 2026 | 1.72 |
| 2025 | 6.84 |
| 2024 | 6.52 |
| 2023 | 5.92 |
| 2022 | 5.12 |
📉 Dividend Growth
Elevance's dividend growth is indicative of its financial health and commitment to increasing shareholder value. It ensures that investors benefit from not only steady income but also enhanced returns over time due to dividend increases.
| Time | Growth |
|---|---|
| 3 years | 10.14 % |
| 5 years | 12.47 % |
The average dividend growth is 12.47 % over 5 years. This shows moderate but steady dividend growth, reflecting the company's robust financial practices and dedication to rewarding its investors.
✅ Payout Ratio
Payout ratios offer insights into the sustainability of a company's dividends relative to its earnings and cash flow. Lower ratios often indicate room for dividend growth and reduced risk of cuts.
| Key figure | Ratio |
|---|---|
| EPS-based | 27.00 % |
| Free cash flow-based | 47.93 % |
With an EPS-based payout ratio of 27.00 % and an FCF-based payout ratio of 47.93 %, Elevance demonstrates efficient and prudent dividend distribution strategies, allowing flexibility and potential for future increases.
Cashflow & Capital Efficiency
Analyzing cash flow and capital efficiency metrics provides insight into how effectively a company utilizes its resources to generate cash while sustaining its operational needs.
| Year | 2025 | 2024 | 2023 |
|---|---|---|---|
| Free Cash Flow Yield | 4.08 % | 5.30 % | 6.15 % |
| Earnings Yield | 7.28 % | 6.96 % | 5.45 % |
| CAPEX to Operating Cash Flow | 26.01 % | 21.63 % | 16.08 % |
| Stock-based Compensation to Revenue | 0.14 % | 0.11 % | 0.17 % |
| Free Cash Flow / Operating Cash Flow Ratio | 73.99 % | 78.37 % | 83.92 % |
The data indicate a stable cash flow situation, suggesting effective resource management and operational strength, vital for ensuring consistent dividend payouts and capital investments.
⚠️ Balance Sheet & Leverage Analysis
This analysis provides an understanding of a company's financial stability, liquidity, and leverage, essential factors for assessing long-term viability and risk management.
| Year | 2025 | 2024 | 2023 |
|---|---|---|---|
| Debt-to-Equity | 75.74 % | 79.15 % | 67.81 % |
| Debt-to-Assets | 27.36 % | 27.98 % | 24.47 % |
| Debt-to-Capital | 43.10 % | 44.18 % | 40.41 % |
| Net Debt to EBITDA | 2.46 | 2.33 | 1.92 |
| Current Ratio | 1.24 | 1.10 | 0.97 |
| Quick Ratio | 1.24 | 1.10 | 0.97 |
| Financial Leverage | 2.77 | 2.83 | 2.77 |
Elevance's leverage ratios, while moderate, reflect a sound debt management strategy and relatively low financial risk, supporting long-term dividend sustainability.
🔍 Fundamental Strength & Profitability
These metrics offer insights into a company's ability to generate profits relative to its equity, assets, and invested capital, essential for assessing overall business health and potential for growth.
| Year | 2025 | 2024 | 2023 |
|---|---|---|---|
| Return on Equity | 12.90 % | 14.47 % | 15.23 % |
| Return on Assets | 4.66 % | 5.12 % | 5.50 % |
| Margins: Net | 2.84 % | 3.38 % | 3.49 % |
| EBIT Margin | 4.07 % | 5.14 % | 5.10 % |
| EBITDA Margin | 4.85 % | 5.93 % | 6.12 % |
| Gross Margin | 25.56 % | 27.85 % | 27.44 % |
| Research & Development to Revenue | 0 % | 0 % | 0 % |
Elevance showcases robust profitability with improving return metrics and stable margins, reinforcing its capability to sustain competitive operations and shareholder returns.
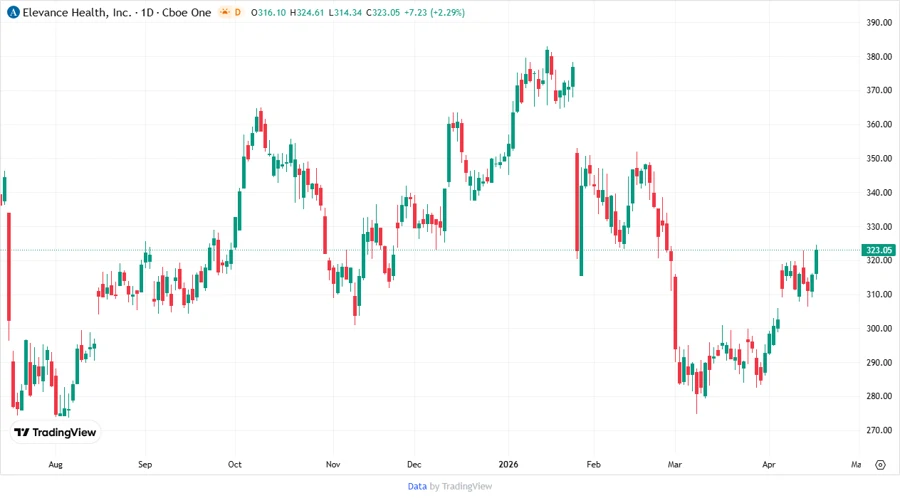
Price Development
Dividend Scoring System
| Category | Score | |
|---|---|---|
| Dividend yield | 3 | |
| Dividend Stability | 5 | |
| Dividend growth | 4 | |
| Payout ratio | 5 | |
| Financial stability | 4 | |
| Dividend continuity | 5 | |
| Cashflow Coverage | 4 | |
| Balance Sheet Quality | 4 |
Total Score: 34/40
Rating
Elevance Health Inc. stands out as a solid investment in the dividend sphere, showcasing a remarkable blend of stability and growth potential. The company's disciplined financial governance is reflected in its high dividend continuity and stable payout ratios. Elevance is recommended as a sound choice for investors seeking consistent returns and long-term growth prospects.
Smart Data Insight
Master the Perfect Entry & Exit for this Stock
Don't leave your profits to chance. Historically, this stock follows specific seasonal patterns that institutional traders use to maximize returns.
- ✅ Identify the "Golden Buying Window"
- ✅ Avoid high-risk correction cycles
- ✅ Backtested data from the last 20+ years