June 16, 2026 a 06:00 pm

EIX: Fundamental Ratio Analysis - Edison International
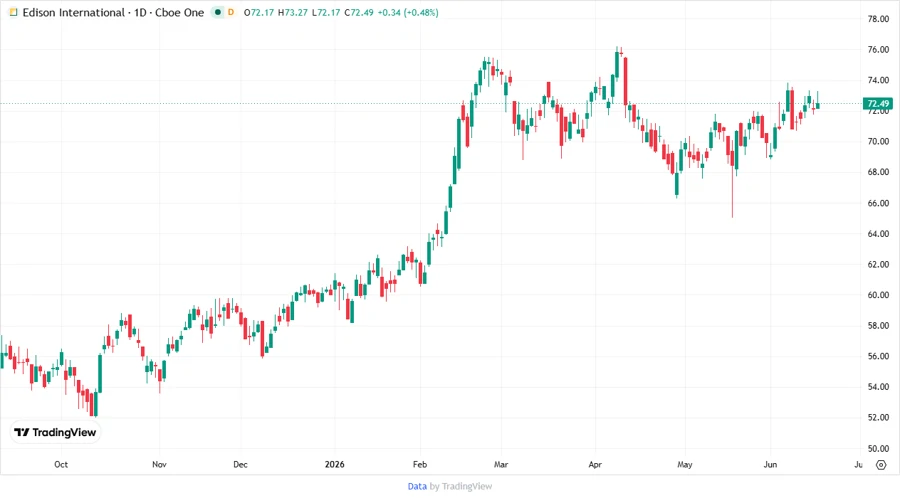
Edison International, as a key utility provider in California, showcases strong fundamentals backed by robust infrastructure and a comprehensive energy solution portfolio. Despite some current valuation challenges, the company's long-standing industry presence and strategic direction offer resilience against market fluctuations.
Fundamental Rating
The fundamental ratings offer a mixed perspective for Edison International, with notable strengths in equity returns but some concerns over cash flow and debt metrics.
| Category | Score | Visualization |
|---|---|---|
| Discounted Cash Flow | 1 | |
| Return on Equity | 5 | |
| Return on Assets | 4 | |
| Debt to Equity | 1 | |
| Price to Earnings | 4 | |
| Price to Book | 3 |
Historical Rating
A comparison of past and present scores indicates stability in performance metrics, with a consistent approach to financial management.
| Date | Overall | DCF | ROE | ROA | D/E | P/E | P/B |
|---|---|---|---|---|---|---|---|
| 2026-06-16 | 3 | 1 | 5 | 4 | 1 | 4 | 3 |
| Previous | 0 | 1 | 5 | 4 | 1 | 4 | 3 |
Analyst Targets
Analyst targets suggest moderate growth potential with a consensus rating indicating optimism among analysts.
| High | Low | Median | Consensus |
|---|---|---|---|
| $79 | $62 | $77.5 | $74.17 |
Analyst Sentiment
The analyst sentiment underscores a general 'Buy' orientation, reflecting confidence in Edison International's market position.
| Recommendation | Count | Percentage |
|---|---|---|
| Strong Buy | 0 | |
| Buy | 19 | |
| Hold | 14 | |
| Sell | 4 | |
| Strong Sell | 0 |
Conclusion
Edison International exhibits a robust infrastructure and a commitment to the energy sector, positioning it well for future growth. While current financial metrics show areas for improvement, particularly in cash flow and debt management, the company's stable ratings and positive analyst sentiment suggest resilience in a competitive market. Investors should weigh these strengths against potential risks, particularly regulatory changes and operational costs in the utility sector. Overall, Edison International remains a viable consideration for those seeking long-term stability in their investment portfolios.
Smart Data Insight
Master the Perfect Entry & Exit for this Stock
Don't leave your profits to chance. Historically, this stock follows specific seasonal patterns that institutional traders use to maximize returns.
- ✅ Identify the "Golden Buying Window"
- ✅ Avoid high-risk correction cycles
- ✅ Backtested data from the last 20+ years