March 05, 2026 a 11:44 am
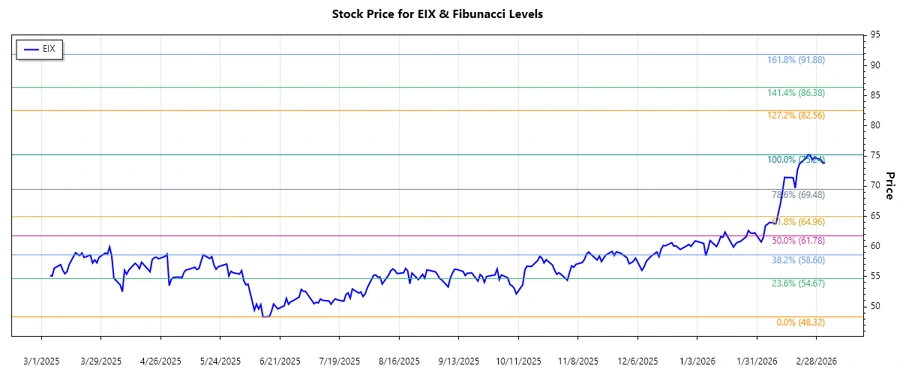
EIX: Fibonacci Analysis - Edison International
Edison International has shown a resilient uptrend over the past months, highlighting strong interest from investors. With its robust infrastructure for electricity delivery across California, the company remains a key player in the energy sector. Recent data indicates a stable performance, with potential for further growth as demand for sustainable energy solutions increases.
Fibonacci Analysis
| Analysis Details | Data |
|---|---|
| Trend Start Date | 2025-06-12 |
| Trend End Date | 2026-03-04 |
| High Point | $75.24 on 2026-02-24 |
| Low Point | $48.32 on 2025-06-13 |
| Fibonacci Level | Price Level |
|---|---|
| 0.236 | $55.53 |
| 0.382 | $59.96 |
| 0.5 | $63.78 |
| 0.618 | $67.60 |
| 0.786 | $72.18 |
Current Price: $73.89
Retracement Zone: 0.786
Interpretation: The current price is approaching a critical resistance level near the 0.786 Fibonacci retracement level, indicating a potential reversal if momentum decreases significantly.
Conclusion
Edison International's stock demonstrated a notable uptrend from mid-2025 to early 2026, with the potential to exceed previous highs. The stock is currently in the 0.786 Fibonacci retracement zone, suggesting vigilance for potential price corrections. However, strong fundamentals and increased demand for electricity favor potential continued growth. It is essential for investors to monitor the stock's resistance levels and market conditions closely. As a leader in energy distribution, Edison International remains a compelling option, though investors should remain cautious of broader macroeconomic influences.