November 21, 2025 a 06:44 am
EIX: Fibonacci Analysis - Edison International
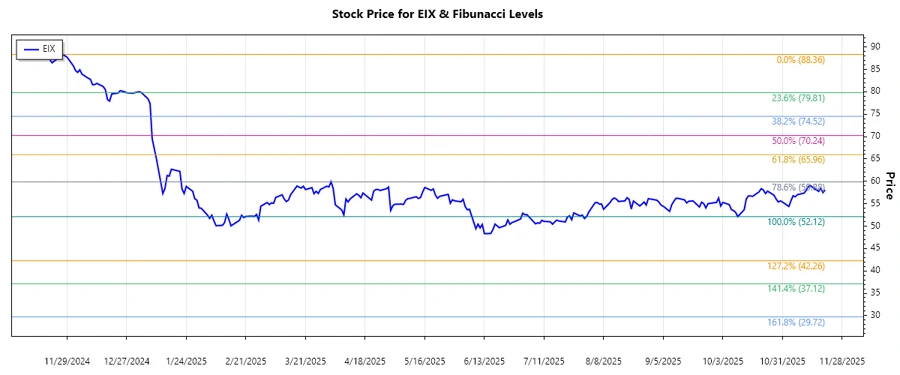
Edison International has shown resilience in a volatile market, with its stock displaying considerable shifts over the recent months. The company's wide reach in the electricity distribution sector provides a stable foundation amidst economic fluctuations. Edison International’s stock performance indicates a dominant downward trend, which could be of interest to traders looking for buying opportunities once the market stabilizes.
Fibonacci Analysis
| Start Date | End Date | High Price | High Date | Low Price | Low Date |
|---|---|---|---|---|---|
| 2024-11-21 | 2025-11-20 | 88.36 | 2024-11-27 | 52.12 | 2025-10-10 |
| Fibonacci Level | Price Level |
|---|---|
| 0.236 | 61.77 |
| 0.382 | 66.11 |
| 0.5 | 70.24 |
| 0.618 | 74.37 |
| 0.786 | 80.23 |
The current price of 58.08 is located below the 0.236 retracement level, indicating that the price may find support yet below key Fibonacci levels. This suggests potential further decline towards the low, with possible support around the Fibonacci extensions noted.
Conclusion
The Edison International stock demonstrates a significant downward trend over the past year. With the current price hovering below critical Fibonacci retracement levels, there are risks of further decreases. However, these conditions present potential buying opportunities for investors seeking longer-term gains, once price action stabilizes. Analysts should weigh these factors against external influences such as broader market trends and regulatory impacts within the energy sector. Keeping a close watch on company developments and industry shifts will be crucial.
Smart Data Insight
Master the Perfect Entry & Exit for this Stock
Don't leave your profits to chance. Historically, this stock follows specific seasonal patterns that institutional traders use to maximize returns.
- ✅ Identify the "Golden Buying Window"
- ✅ Avoid high-risk correction cycles
- ✅ Backtested data from the last 20+ years