October 23, 2025 a 04:45 pm
EIX: Fibonacci Analysis - Edison International
Edison International has shown resilience in its business model through sound energy solutions. The stock has experienced a significant downward trend, indicating potential buying opportunities for long-term investors. However, prospective investors should be cautious of market volatility. Understanding key retracement levels could aid in identifying short-term support and resistance areas.
Fibonacci Analysis
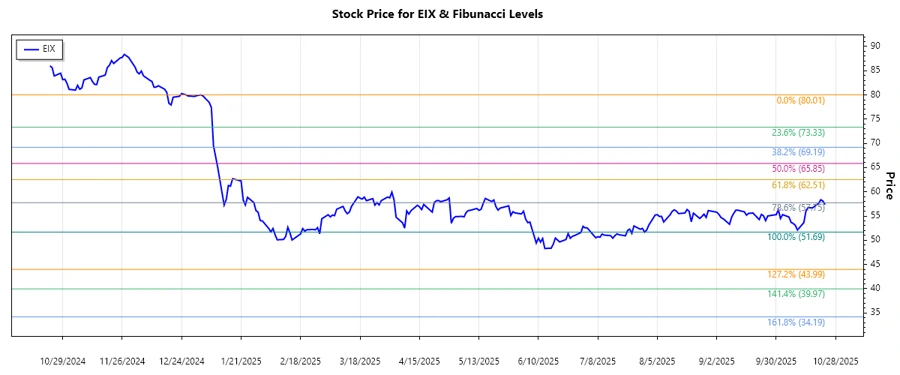
In order to understand the stock performance of Edison International (Ticker: EIX), we performed a Fibonacci Retracement analysis for the downtrend observed. This analysis aims to provide insights into potential price reversals.
| Detail | Information |
|---|---|
| Trend | Downward |
| Start Date | 2025-01-02 |
| End Date | 2025-10-23 |
| High (Price, Date) | $80.01, 2025-01-02 |
| Low (Price, Date) | $51.69, 2025-07-30 |
Fibonacci Retracement Levels
| Level | Price |
|---|---|
| 0.236 | $58.78 |
| 0.382 | $62.55 |
| 0.5 | $65.85 |
| 0.618 | $69.14 |
| 0.786 | $73.75 |
Current price sits around $57.36, slightly above the 0.236 Fibonacci level, suggesting it has recently broken the initial level of resistance. This level currently acts as a support zone.
From a technical perspective, the price breaking above the 0.236 Fibonacci level indicates a possible temporary halt in the downward momentum, suggesting a potential area to look for consolidation or a minor reversal.
Conclusion
Edison International's current market performance indicates a persistent downtrend. The findings from the Fibonacci analysis suggest potential for short-term price rebounds, especially if the stock sustains its level above the 0.236 retracement. However, given the persistent downward trend, investors should closely monitor for additional confirmation indicators prior to assuming reversals. Ultimately, while an opportunity exists for speculators to benefit from short-term price movements, risk-averse investors might consider awaiting more stable signals of reversal.
Smart Data Insight
Master the Perfect Entry & Exit for this Stock
Don't leave your profits to chance. Historically, this stock follows specific seasonal patterns that institutional traders use to maximize returns.
- ✅ Identify the "Golden Buying Window"
- ✅ Avoid high-risk correction cycles
- ✅ Backtested data from the last 20+ years