October 01, 2025 a 06:44 am
EIX: Fibonacci Analysis - Edison International
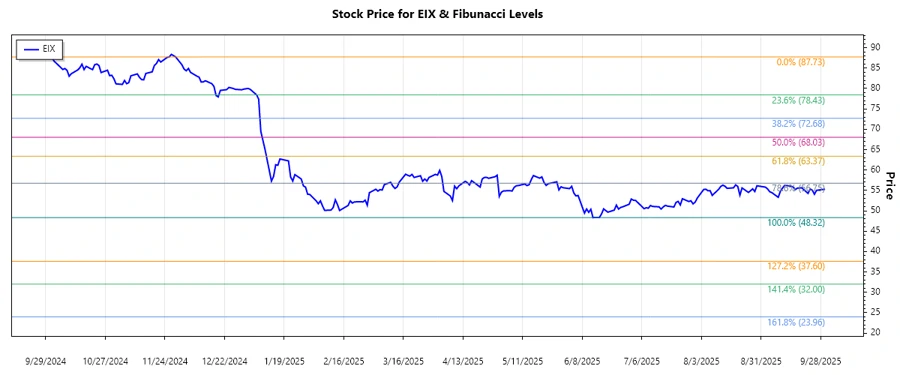
Edison International (EIX) has shown a noticeable downtrend in the last few months, largely due to fluctuations in the energy sector and market dynamics. Analyzing the data reveals potential recovery signals, specifically when examining possible retracement levels. As California's key electricity provider, Edison International faces challenges, but remains a cornerstone in energy supply. Investors must watch regulatory changes and market sentiment impacting this stock.
Fibonacci Analysis
| Detail | Value |
|---|---|
| Start Date | 2024-10-01 |
| End Date | 2025-09-30 |
| High Price | $87.73 (2024-10-01) |
| Low Price | $48.32 (2025-06-13) |
Fibonacci Levels
| Level | Price |
|---|---|
| 0.786 | $77.02 |
| 0.618 | $68.87 |
| 0.5 | $65.95 |
| 0.382 | $63.03 |
| 0.236 | $59.72 |
As of September 30, 2025, with a closing price of $55.28, EIX is trading below the 23.6% retracement level, indicating it is not currently in a significant retracement zone. This suggests potential continued resistance or further downward pressure in the short term.
Conclusion
Edison International's (EIX) stock has experienced a significant downtrend over the last few months. Technical indicators show some potential for recovery, although the stock currently trades below its major retracement levels. Analysts need to consider broader market conditions and sector-specific challenges, including regulatory impacts. While the stock holds long-term potential given its key role in the energy infrastructure in California, short-term risks cannot be ignored. Consistent monitoring of energy policies and market trends is crucial for making informed investment decisions in EIX.
Smart Data Insight
Master the Perfect Entry & Exit for this Stock
Don't leave your profits to chance. Historically, this stock follows specific seasonal patterns that institutional traders use to maximize returns.
- ✅ Identify the "Golden Buying Window"
- ✅ Avoid high-risk correction cycles
- ✅ Backtested data from the last 20+ years