June 01, 2026 a 12:46 pm


EIX: Dividend Analysis - Edison International
Edison International, a stalwart in the utilities sector, boasts a commendable dividend history characterized by over five decades of consistent payouts. With a current dividend yield of 4.70%, the dividend per share stands strong at $3.58, indicating the company's commitment to returning value to its shareholders. Despite facing economic headwinds, Edison International has demonstrated resilience with no suspension or reduction in its dividends in recent history. This consistency is a testament to its robust business model and efficient management.
📊 Overview
The company operates within the utilities sector, exhibiting a promising dividend yield of 4.70%. Currently, the dividend per share is at $3.58. Impressively, Edison International has sustained its dividend payouts for 51 years, showcasing reliable income generation for investors.
| Metric | Value |
|---|---|
| Sector | Utilities |
| Dividend yield | 4.70 % |
| Current dividend per share | 3.58 USD |
| Dividend history | 51 years |
| Last cut or suspension | None |
📈 Dividend History
An established dividend payer, Edison International's lengthy 51-year track record of dividend distribution is indicative of sustained earnings and solid capital management. This history is vital for income-oriented investors seeking stable returns over time.
| Year | Dividend Per Share (USD) |
|---|---|
| 2026 | 1.7550 |
| 2025 | 3.3100 |
| 2024 | 2.3400 |
| 2023 | 2.9925 |
| 2022 | 2.8375 |
📈 Dividend Growth
Monitoring dividend growth is crucial as it indicates the company's potential to enhance shareholder value. Over the past three years, dividends have grown by approximately 5.27%, and over five years, by 5.15% annually, reflecting a moderate but steady increase.
| Time | Growth |
|---|---|
| 3 years | 5.27 % |
| 5 years | 5.15 % |
The average dividend growth is 5.15% over 5 years. This shows moderate but steady dividend growth.
✅ Payout Ratio
The payout ratio is a vital metric, assessing how much of earning is returned to shareholders as dividends. Currently, the EPS payout ratio stands at 37.23%, while the Free Cash Flow (FCF) based figure is concerning at -214.19%, indicating unsustainable dividend funding from cash flow perspectives.
| Key Figure | Ratio |
|---|---|
| EPS-based | 37.23 % |
| Free cash flow-based | -214.19 % |
The EPS-based payout ratio is healthy, reflecting a sustainable dividend, but the negative FCF ratio suggests potential cash flow challenges.
💰 Cashflow & Capital Efficiency
A thorough examination of cashflow metrics sheds light on operational efficiency and financial health, vital for sustaining dividend payments.
| Metric | 2023 | 2024 | 2025 |
|---|---|---|---|
| Free Cash Flow Yield | -7.48% | -2.25% | -3.09% |
| Earnings Yield | 5.14% | 5.02% | 19.72% |
| CAPEX to Operating Cash Flow | 160.19% | 113.82% | 112.33% |
| Stock-based Compensation to Revenue | 0% | 0% | 0% |
| Free Cash Flow / Operating Cash Flow Ratio | -60.19% | -13.82% | -12.33% |
The evident volatility in free cash flow yields suggests liquidity pressure, though the earnings yield presents a more favorable view of potential returns.
⚡ Balance Sheet & Leverage Analysis
Understanding a company's leverage and balance sheet health are pivotal for gauging financial stability and risk exposure.
| Metric | 2023 | 2024 | 2025 |
|---|---|---|---|
| Debt-to-Equity Ratio | 2.28 | 2.43 | 2.42 |
| Debt-to-Assets Ratio | 43.19% | 44.12% | 45.30% |
| Debt-to-Capital Ratio | 69.49% | 70.81% | 70.78% |
| Net Debt to EBITDA | 5.98 | 5.90 | 5.15 |
| Current Ratio | 0.79 | 0.85 | 0.73 |
| Quick Ratio | 0.73 | 0.78 | 0.68 |
The overall high leverage points toward potentially significant risk, mitigated slightly by strong interest coverage ratios.
💪 Fundamental Strength & Profitability
Profitability ratios are key to understanding a company's operational success and ability to generate profit from investments.
| Metric | 2023 | 2024 | 2025 |
|---|---|---|---|
| Return on Equity | 9.08% | 9.93% | 25.92% |
| Return on Assets | 1.72% | 1.81% | 4.85% |
| Net Profit Margin | 8.61% | 8.78% | 23.59% |
| EBIT Margin | 19.14% | 19.50% | 28.33% |
| EBITDA Margin | 35.79% | 36.20% | 42.69% |
| Gross Margin | 41.09% | 41.01% | 57.83% |
| Research & Development to Revenue | 0% | 0% | 2.40% |
The robust ROE and margin figures reflect strong management capabilities, though the absence of R&D spending may limit future growth prospects.
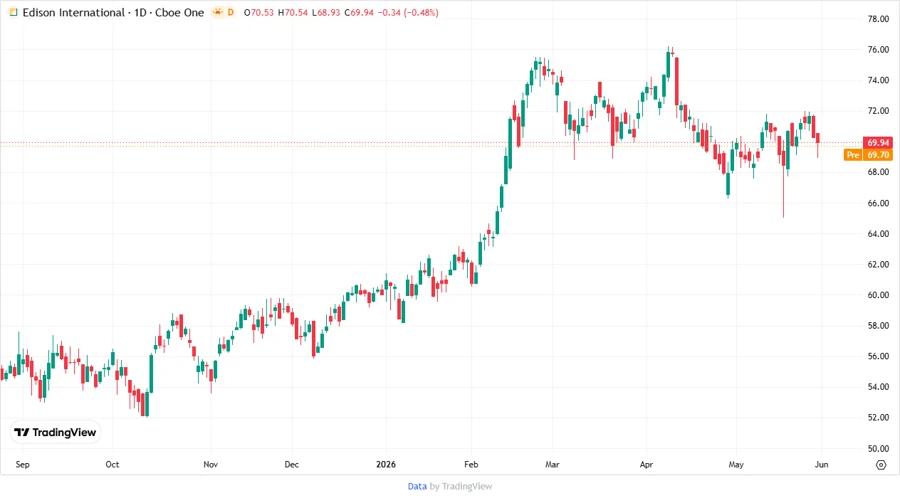
📉 Price Development
🗣️ Dividend Scoring System
| Category | Score (1-5) | Score Bar |
|---|---|---|
| Dividend yield | 4 | |
| Dividend Stability | 5 | |
| Dividend growth | 3 | |
| Payout ratio | 2 | |
| Financial stability | 3 | |
| Dividend continuity | 5 | |
| Cashflow Coverage | 2 | |
| Balance Sheet Quality | 3 |
Total Score: 27/40
🗳️ Rating
Edison International presents a solid dividend profile backed by its lengthy history of reliable payouts. While the company's payout ratio from earnings remains sustainable, the negative FCF ratio is concerning and underscores the need for improved cash flow management. With a commendable dividend yield and historical continuity, investors may find Edison International an attractive option, provided they are mindful of its leverage and cash flow challenges.
Smart Data Insight
Master the Perfect Entry & Exit for this Stock
Don't leave your profits to chance. Historically, this stock follows specific seasonal patterns that institutional traders use to maximize returns.
- ✅ Identify the "Golden Buying Window"
- ✅ Avoid high-risk correction cycles
- ✅ Backtested data from the last 20+ years