August 26, 2025 a 07:32 am

EIX: Dividend Analysis - Edison International
Edison International, a major player in the utility sector, boasts a robust dividend history with over 50 years of payments. Despite its impressive record, the company's recent dividend cut in 2024 requires scrutiny by income-focused investors. However, its resilience and commitment to shareholder value remain evident through its historically consistent payouts.
Overview 📊
Understanding the core metrics provides a basis for assessing the company's financial health and dividend potential.
| Attribute | Value |
|---|---|
| Sector | Utilities |
| Dividend yield | 6.46% |
| Current dividend per share | 3.33 USD |
| Dividend history | 50 years |
| Last cut or suspension | 2024 |
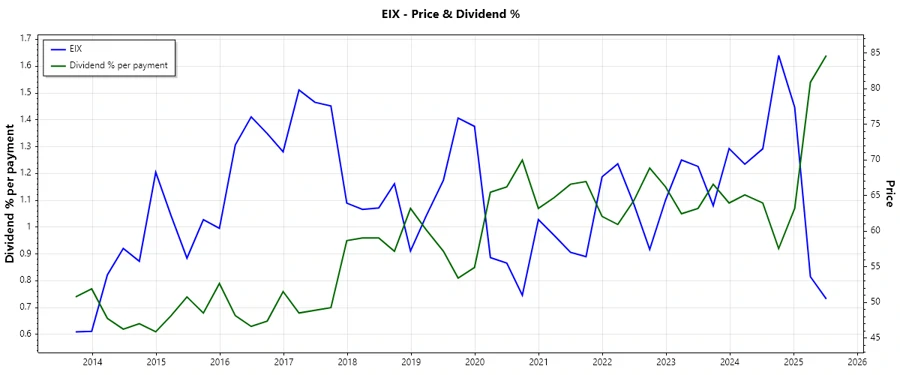
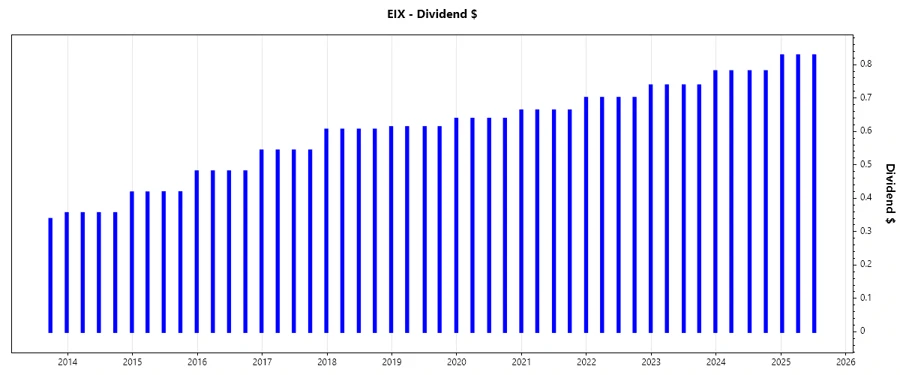
Dividend History 🗣️
The extensive history of dividends underlines the company's commitment to returning capital to shareholders. Dividend history is crucial for evaluating a company's consistency and long-term financial strategy.
| Year | Dividend per Share (USD) |
|---|---|
| 2025 | 2.48 |
| 2024 | 2.34 |
| 2023 | 2.99 |
| 2022 | 2.84 |
| 2021 | 2.69 |
Dividend Growth 📈
Dividend growth is a critical indicator of a company's future earning potential and its commitment to enhancing shareholder returns.
| Time | Growth |
|---|---|
| 3 years | -4.51% |
| 5 years | -1.11% |
The average dividend growth is -1.11% over 5 years. This shows a concerning lack in dividend growth, reflecting challenges in sustaining payouts.
Payout Ratio 💡
The payout ratio indicates how much of the company's earnings are distributed as dividends, showcasing the sustainability of dividends.
| Key figure | Ratio |
|---|---|
| EPS-based | 44.61% |
| Free cash flow-based | -338.29% |
The payout ratio based on EPS at 44.61% seems healthy, supporting dividends from profits. However, the FCF-based ratio at -338.29% raises red flags about cash flow sustainability for payouts.
Cashflow & Capital Efficiency
Assessing cash flow and capital efficiency offers insights into operational efficacy and financial health, influencing dividend capacity.
| Attribute | 2024 | 2023 | 2022 |
|---|---|---|---|
| Free Cash Flow Yield | -2.25% | -7.48% | -10.57% |
| Earnings Yield | 5.02% | 5.14% | 3.40% |
The negative free cash flow yield and high earnings yield indicate issues in cash flow despite profitability, highlighting inefficiencies that may affect dividend safety.
Balance Sheet & Leverage Analysis ⚖️
The balance sheet's strength and leverage levels are vital for understanding financial stability and risk. High leverage indicates greater risk, impacting future dividend safety.
| Attribute | 2024 | 2023 | 2022 |
|---|---|---|---|
| Debt-to-Equity | 2.43 | 2.28 | 2.12 |
| Current Ratio | 0.87 | 0.79 | 0.68 |
The high debt-to-equity ratio and low current ratio suggest increased leverage and potential liquidity issues, which might hinder ongoing dividend capacity and company growth.
Fundamental Strength & Profitability 💪
Profitability metrics provide a snapshot of the company's ability to generate earnings relative to its revenue, assets, and equity, integral for understanding dividend sustainability.
| Attribute | 2024 | 2023 | 2022 |
|---|---|---|---|
| ROE | 9.93% | 9.08% | 5.27% |
| Net Margin | 8.78% | 8.61% | 4.79% |
Edison International shows improving ROE and net margin over time, indicating better profitability, which supports dividend payment ability.
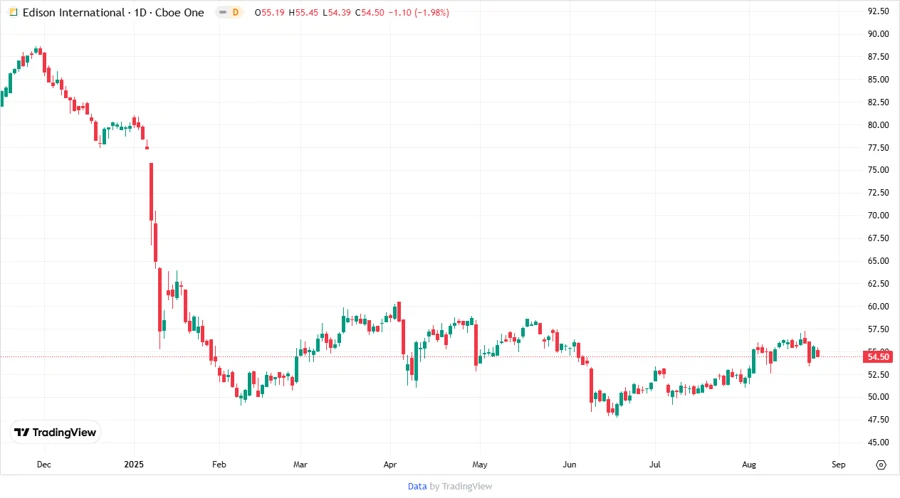
Price Development 📉
Dividend Scoring System ✅
| Criterion | Score | Score Bar |
|---|---|---|
| Dividend yield | 4 | |
| Dividend Stability | 2 | |
| Dividend growth | 2 | |
| Payout ratio | 3 | |
| Financial stability | 2 | |
| Dividend continuity | 3 | |
| Cashflow Coverage | 1 | |
| Balance Sheet Quality | 2 |
Total Score: 19/40
Rating ⚠️
Edison International, with its robust historical dividend record, faces challenges ahead with cuts and negative cash flow metrics. Investors must weigh its strengths against potential cash flow and leverage-induced risks before commitment.
Smart Data Insight
Master the Perfect Entry & Exit for this Stock
Don't leave your profits to chance. Historically, this stock follows specific seasonal patterns that institutional traders use to maximize returns.
- ✅ Identify the "Golden Buying Window"
- ✅ Avoid high-risk correction cycles
- ✅ Backtested data from the last 20+ years