August 16, 2025 a 02:03 pm
EG: Trend and Support & Resistance Analysis - Everest Re Group, Ltd.
Everest Re Group, Ltd., a leading provider of reinsurance and insurance products, has exhibited a mixed performance over the past months. The recent trends indicate variability, with both support and resistance levels encountering pressure. The company's strategic positioning across various global markets is crucial for its future stability and growth.
Trend Analysis
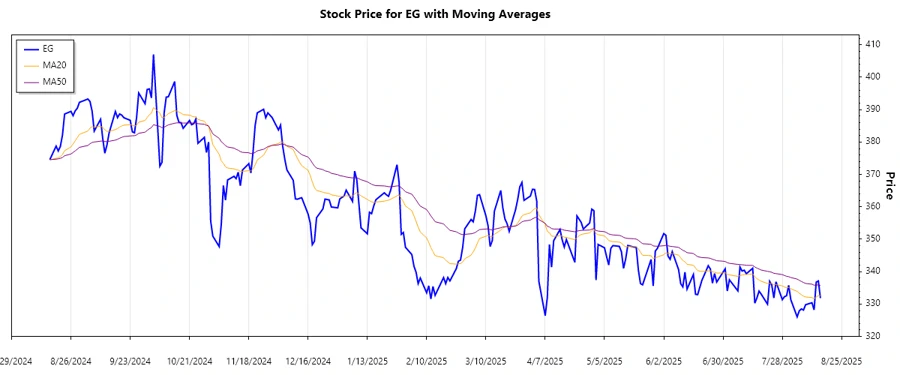
Recent analysis of the Everest Re Group (Ticker: EG) indicates a complex market movement. Examining the EMA20 and EMA50, the current trend can be categorized as follows:
| Date | Closing Price | Trend |
|---|---|---|
| 2025-08-15 | $331.84 | ▼ Down |
| 2025-08-14 | $337.12 | ▲ Up |
| 2025-08-13 | $336.76 | ▼ Down |
| 2025-08-12 | $328.21 | ▼ Down |
| 2025-08-11 | $330.40 | ⚖️ Stable |
| 2025-08-08 | $329.80 | ▼ Down |
| 2025-08-07 | $328.15 | ▼ Down |
The EMA20 remains below the EMA50, signaling an overarching bearish sentiment over the analysis period.
Support and Resistance
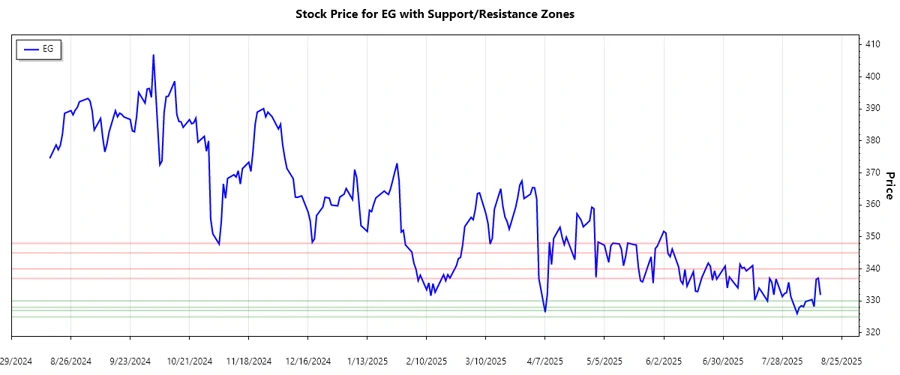
Key support and resistance levels have been identified based on historical closing prices:
| Zone Type | From | To |
|---|---|---|
| Support Zone 1 | ▼ $328.00 | ▼ $330.00 |
| Support Zone 2 | ▼ $325.00 | ▼ $327.00 |
| Resistance Zone 1 | ▲ $337.00 | ▲ $340.00 |
| Resistance Zone 2 | ▲ $345.00 | ▲ $348.00 |
The current price is nearing the lower boundary of the first support zone. Any breach could lead to further declines, while a rebound could signify strength.
Conclusion
Everest Re Group presents both challenges and opportunities in the current market landscape. The dominance of bearish indicators suggests caution, but potential support rebounds could offer bullish opportunities. The company's diversified global operations may provide a strategic advantage, depending on market conditions. Analysts should consider broader economic factors and the company's positioning in the reinsurance sector when making investment decisions.
Smart Data Insight
Master the Perfect Entry & Exit for this Stock
Don't leave your profits to chance. Historically, this stock follows specific seasonal patterns that institutional traders use to maximize returns.
- ✅ Identify the "Golden Buying Window"
- ✅ Avoid high-risk correction cycles
- ✅ Backtested data from the last 20+ years