
June 23, 2026 a 06:44 am

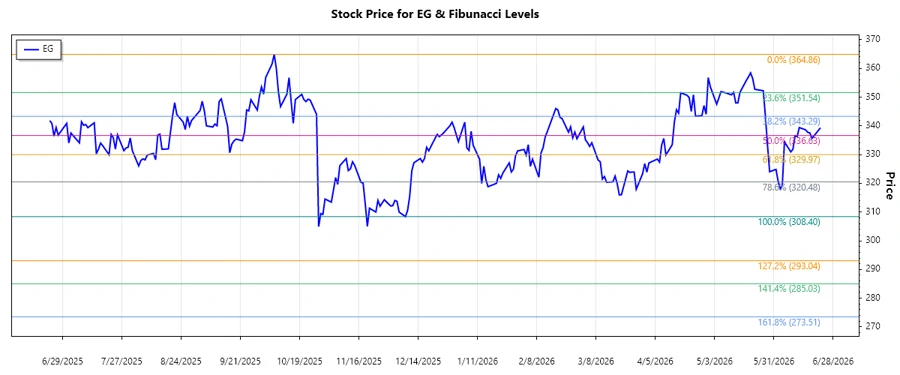
EG: Fibonacci Analysis - Everest Re Group, Ltd.
The Everest Re Group, Ltd. has shown a declining stock performance in recent months. Analyzing the trend, it appears the stock has been on a downward trajectory. This analysis aims to provide insights using Fibonacci retracement levels to estimate potential price movement corrections or continuations.
Fibonacci Analysis
| Information | Details |
|---|---|
| Trend Period | November 03, 2025 - June 22, 2026 |
| High Point | $364.86 on October 07, 2025 |
| Low Point | $308.4 on December 08, 2025 |
| Fibonacci Levels (0.236) | $322.16 |
| Fibonacci Levels (0.382) | $331.69 |
| Fibonacci Levels (0.5) | $336.63 |
| Fibonacci Levels (0.618) | $341.57 |
| Fibonacci Levels (0.786) | $349.23 |
| Current Price Zone | 0.236 Fibonacci Level |
| Technical Interpretation | The price currently hovers around the 23.6% retracement level, signalling potential for rebound if support holds. |
Conclusion
The analysis of the Fibonacci retracement levels suggests that the Everest Re Group, Ltd. stock is currently in a potential support zone at the 23.6% level. If the stock maintains its position and rebounds, it could indicate a shift towards a more stable or upward trend, presenting a buying opportunity. However, if the stock breaks below this level, further declines may occur, requiring caution from investors. The analysis underscores the importance of monitoring this level for any durable price movement. Keeping an eye on broader market conditions and company-specific news will be crucial in assessing future price dynamics.
Smart Data Insight
Master the Perfect Entry & Exit for this Stock
Don't leave your profits to chance. Historically, this stock follows specific seasonal patterns that institutional traders use to maximize returns.
- ✅ Identify the "Golden Buying Window"
- ✅ Avoid high-risk correction cycles
- ✅ Backtested data from the last 20+ years