
June 20, 2026 a 10:15 am

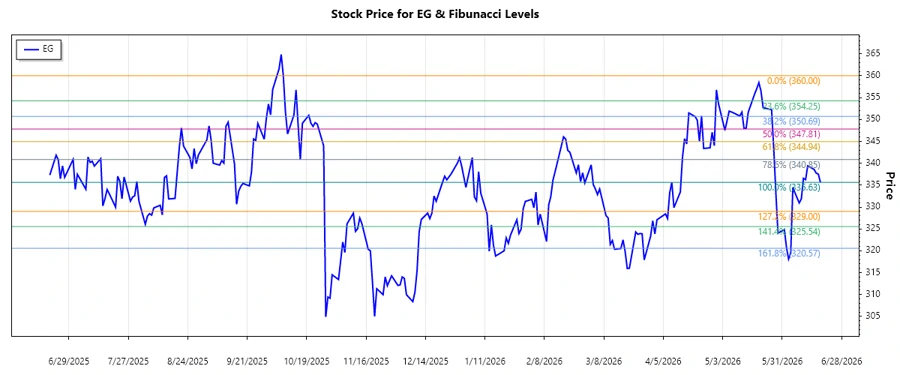
EG: Fibonacci Analysis - Everest Re Group, Ltd.
The stock of Everest Re Group, Ltd. (EG) has demonstrated a fluctuating pattern in recent months, with recent data indicating a potential downward trend. Given the company’s diversified reinsurance and insurance offerings, this trend could affect their revenue streams differently across various regions and sectors. Careful market monitoring is advised for investors as the technical analysis presents key insights into future price movements.
Fibonacci Analysis
Based on the analysis of the historical price data, we have identified a significant downtrend in the EG stock. This trend started around October 8, 2025, with a high price of $360.00 and proceeded to a low on June 18, 2026, at $335.63. To provide deeper insights into this trend, Fibonacci retracement levels have been calculated.
| Start Date | End Date | High (Price & Date) | Low (Price & Date) |
|---|---|---|---|
| 2025-10-08 | 2026-06-18 | $360.00 on 2025-10-08 | $335.63 on 2026-06-18 |
| Fibonacci Level | Price ($) |
|---|---|
| 0.236 | 354.418 |
| 0.382 | 351.021 |
| 0.500 | 347.815 |
| 0.618 | 344.609 |
| 0.786 | 340.202 |
Currently, the price is near $335.63, which is below the Fibonacci retracement levels. This suggests the stock is not within any retracement zone, indicating the downtrend is still prevailing.
Technical interpretation suggests potential resistance at higher Fibonacci levels (such as $354.418) and a continuation of the downtrend if these levels are not breached.
Conclusion
The analysis of Everest Re Group, Ltd.'s stock reveals a notable downtrend over recent months, impacting the company's stock value adversely. The absence of a retracement zone engagement suggests continued price pressure, while technical resistance levels must be closely watched. Investors should consider the inherent risks associated with this downward momentum and the company's strong market position which may offer opportunities for growth if market conditions improve.
Smart Data Insight
Master the Perfect Entry & Exit for this Stock
Don't leave your profits to chance. Historically, this stock follows specific seasonal patterns that institutional traders use to maximize returns.
- ✅ Identify the "Golden Buying Window"
- ✅ Avoid high-risk correction cycles
- ✅ Backtested data from the last 20+ years